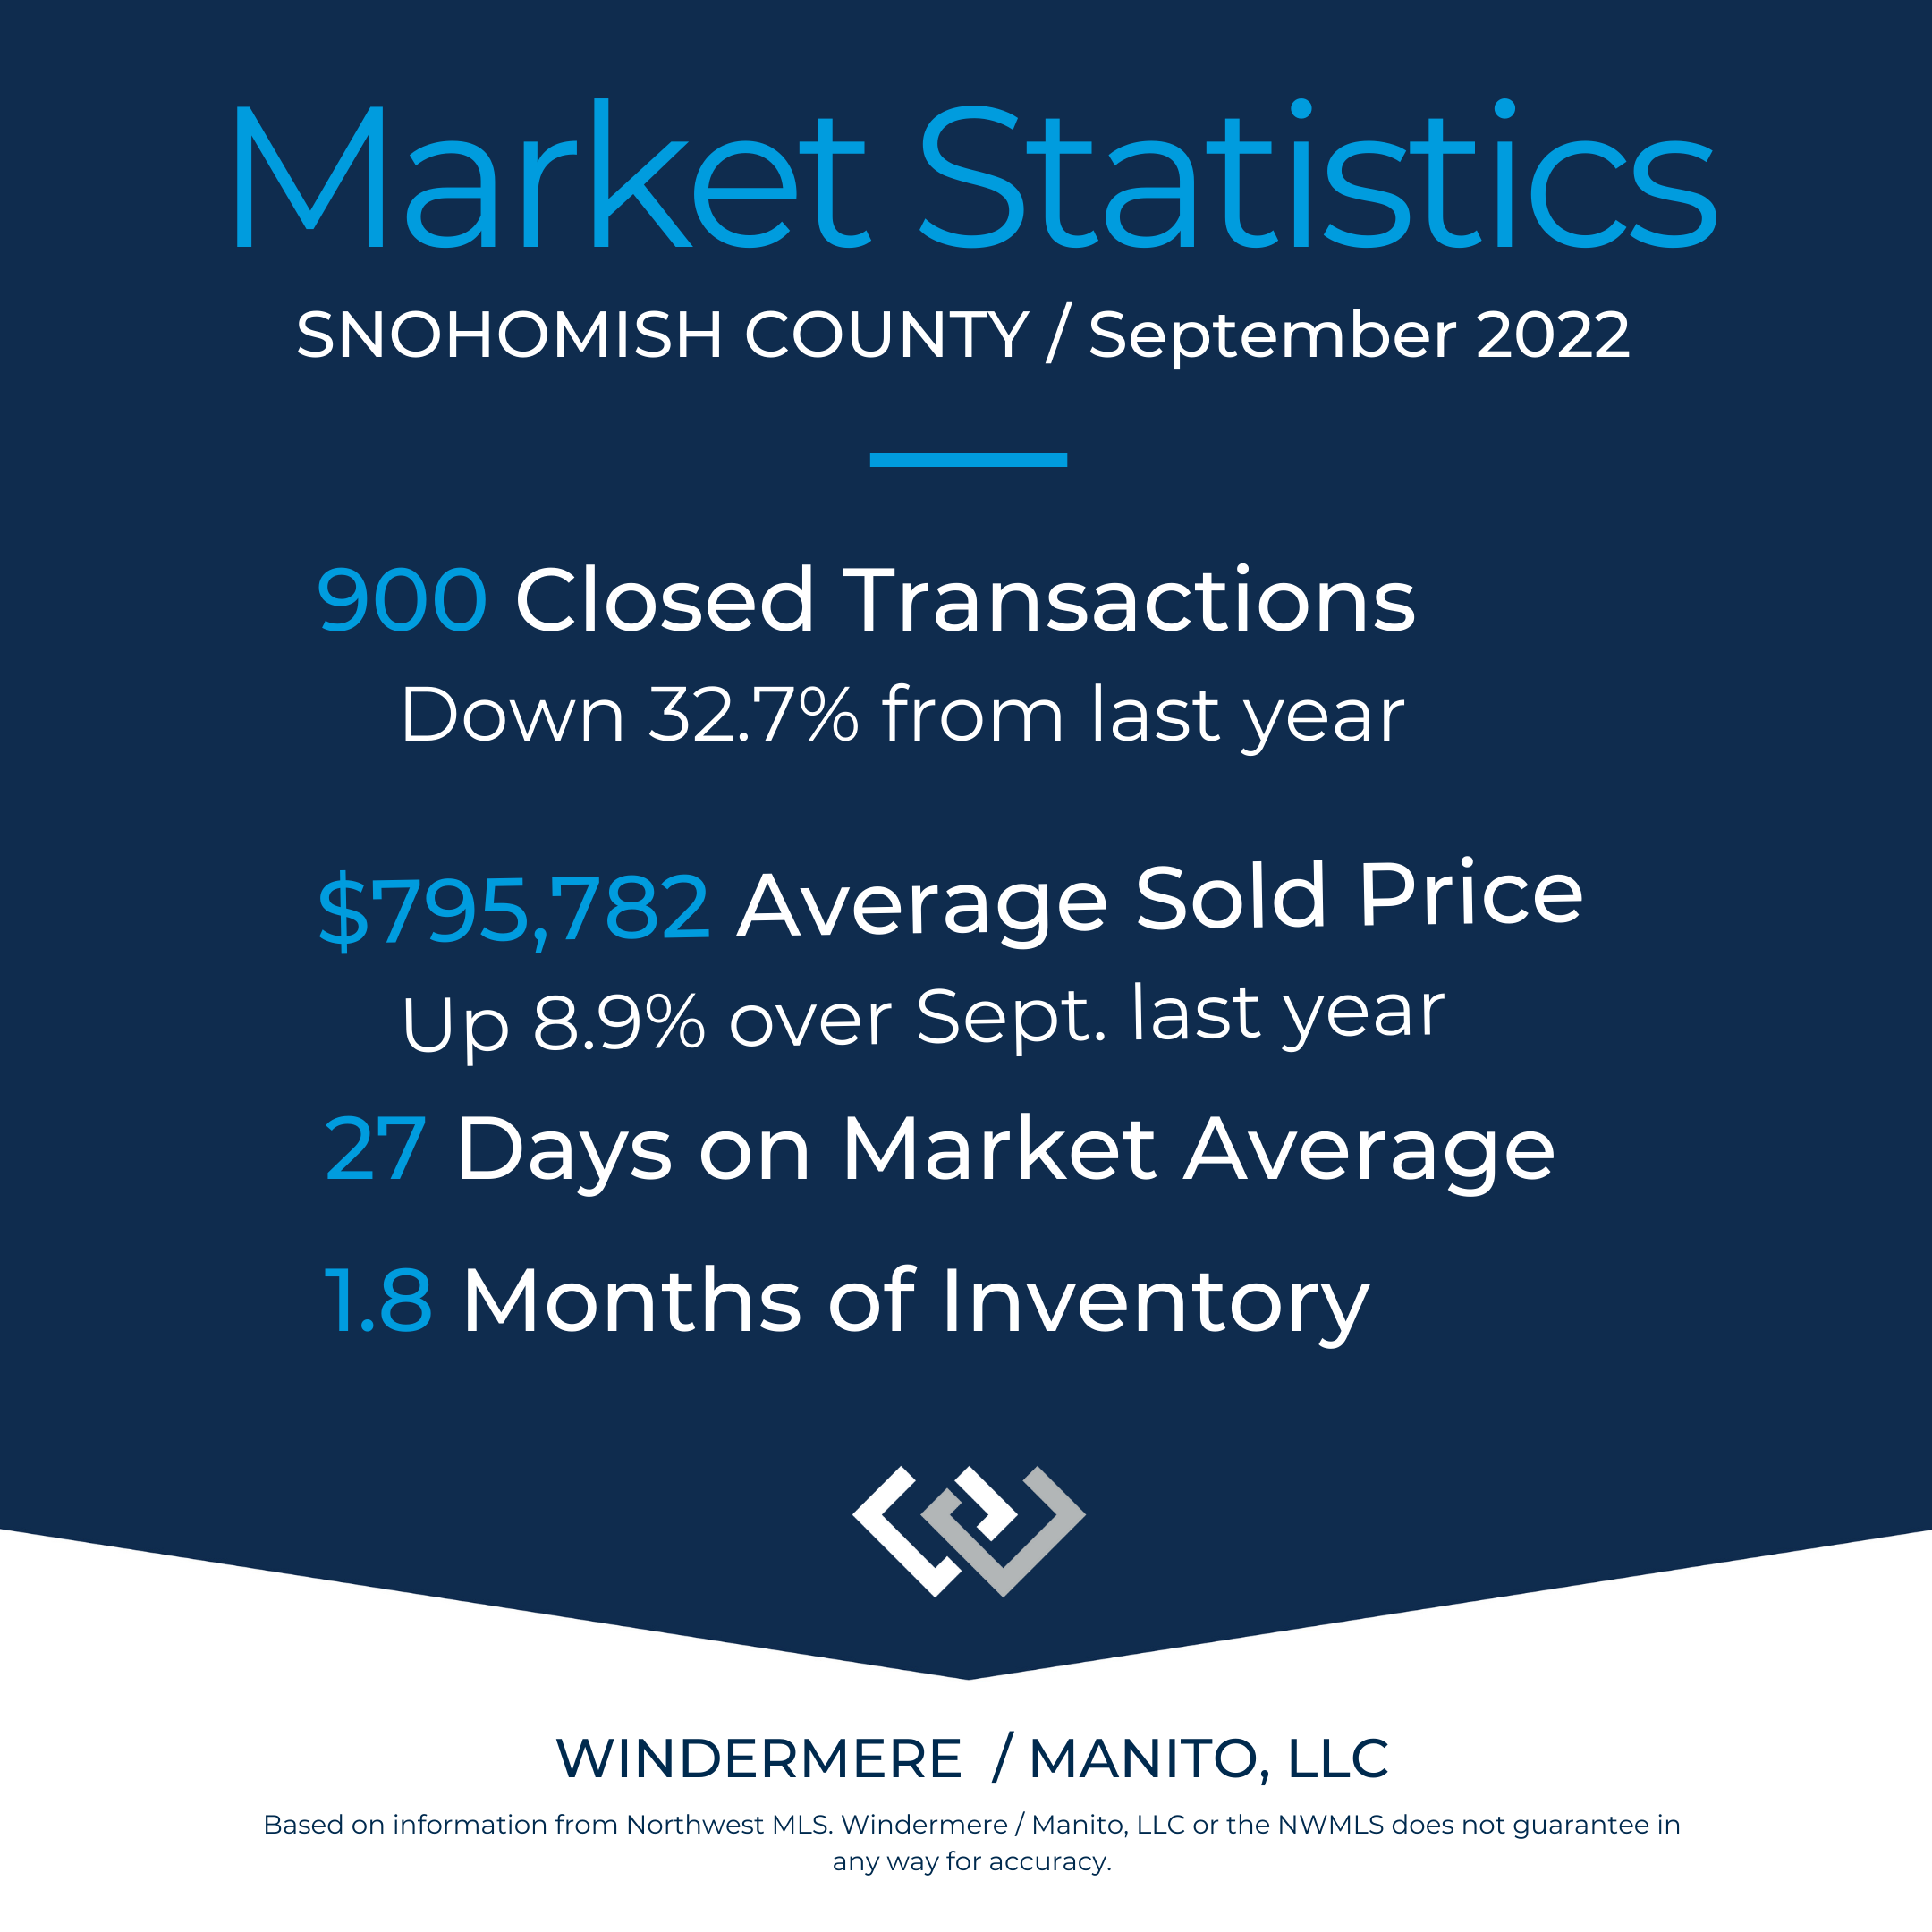
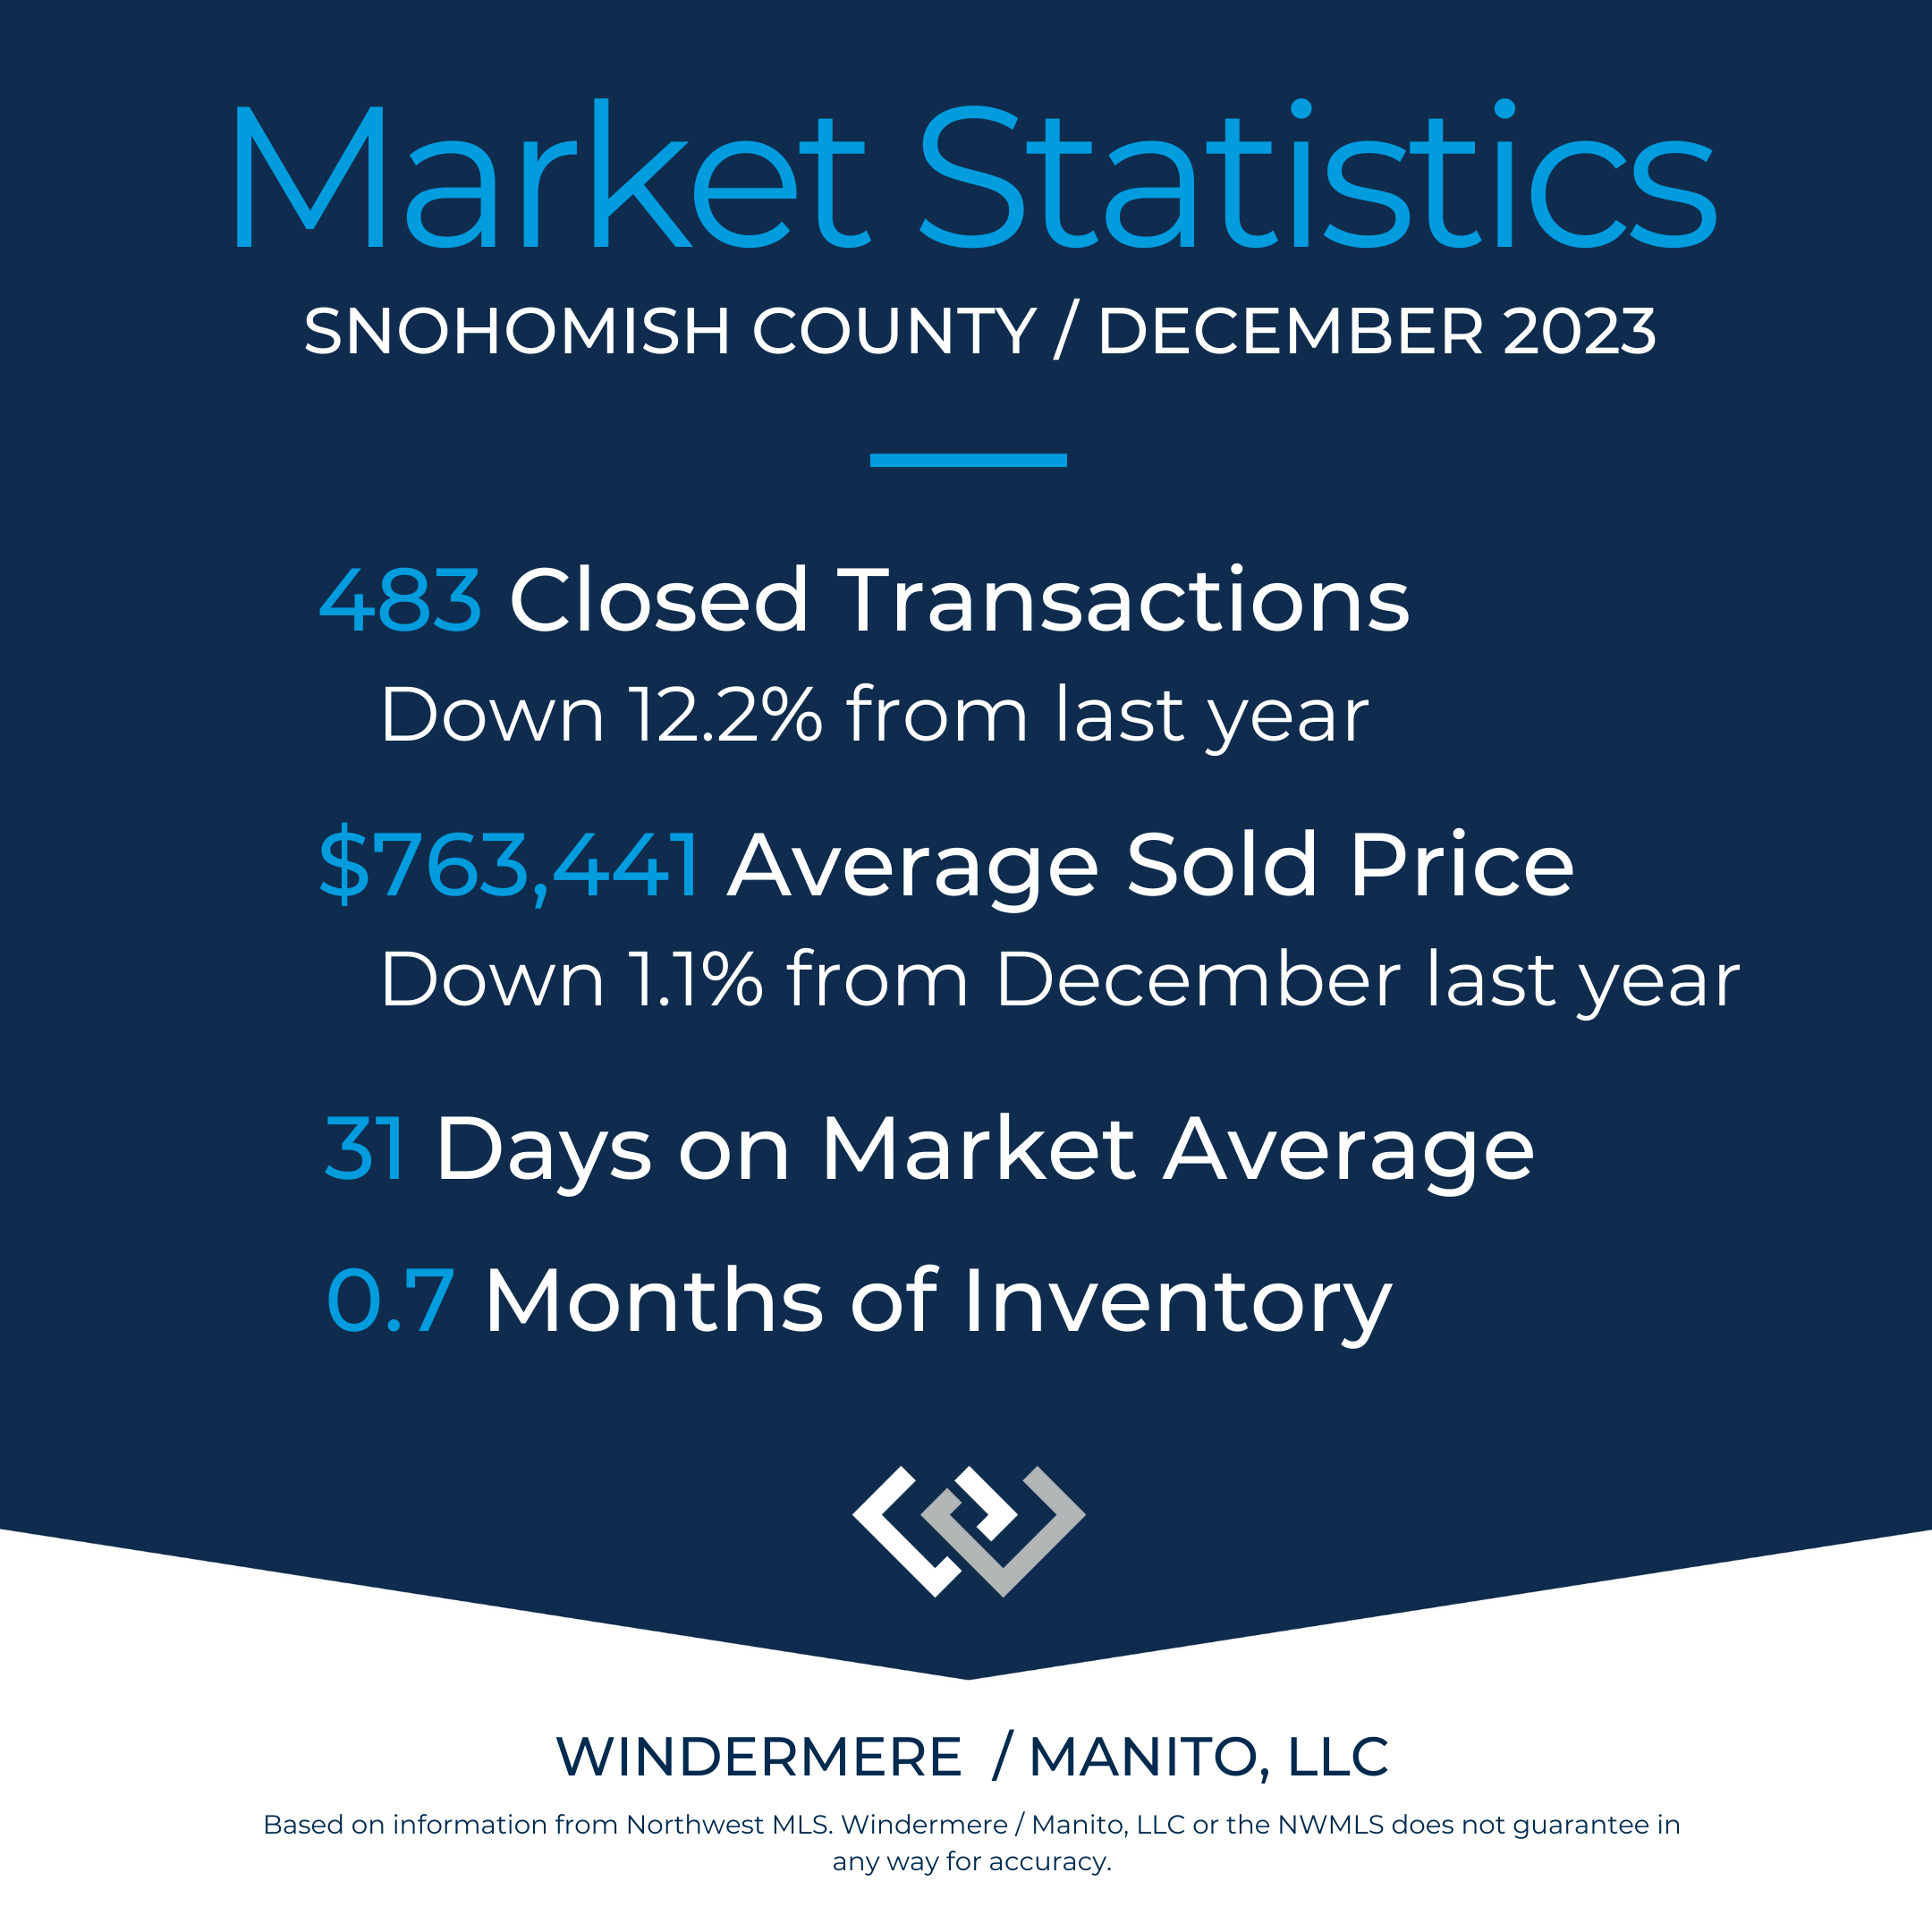
Breaking Down the Numbers | Snohomish County, January 2025
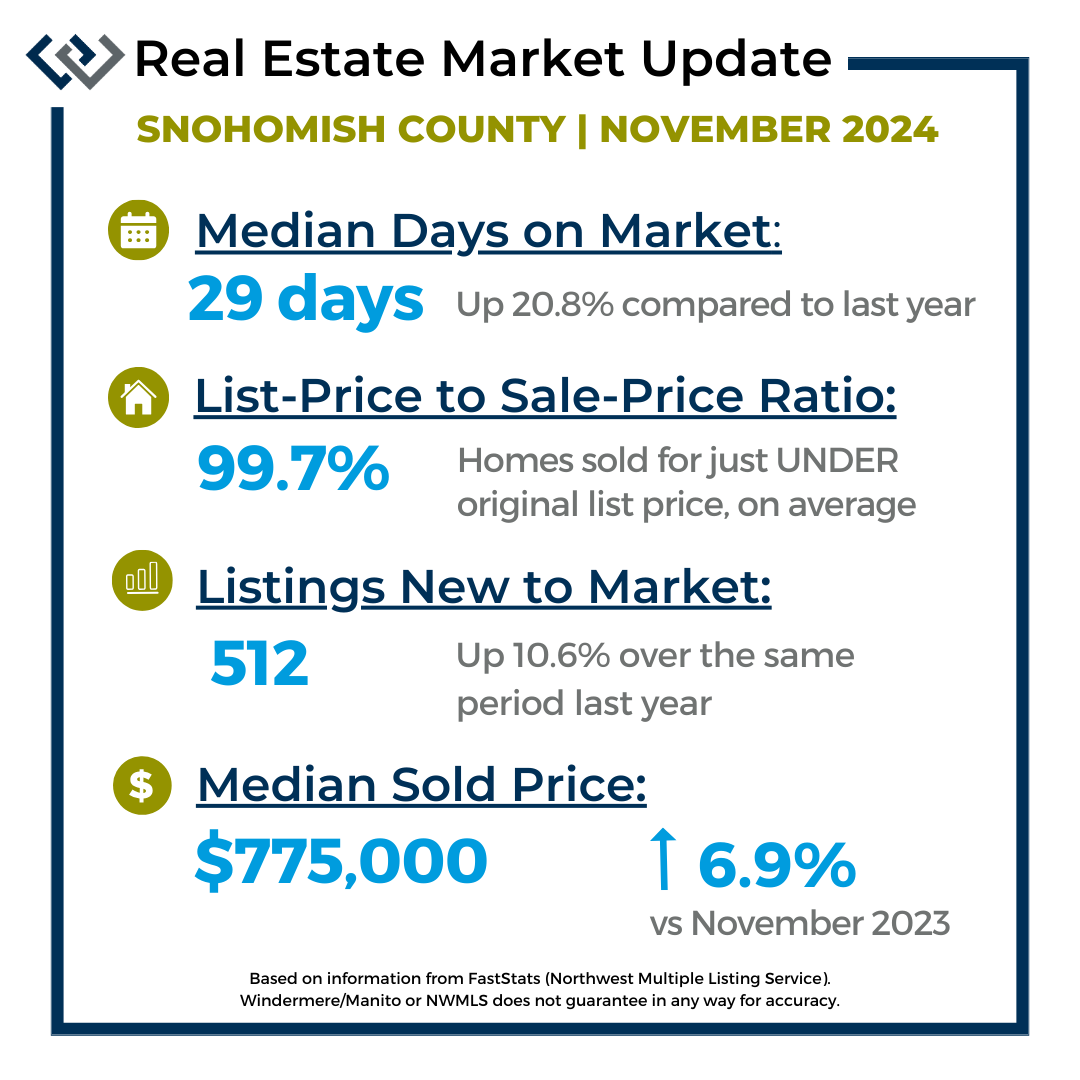
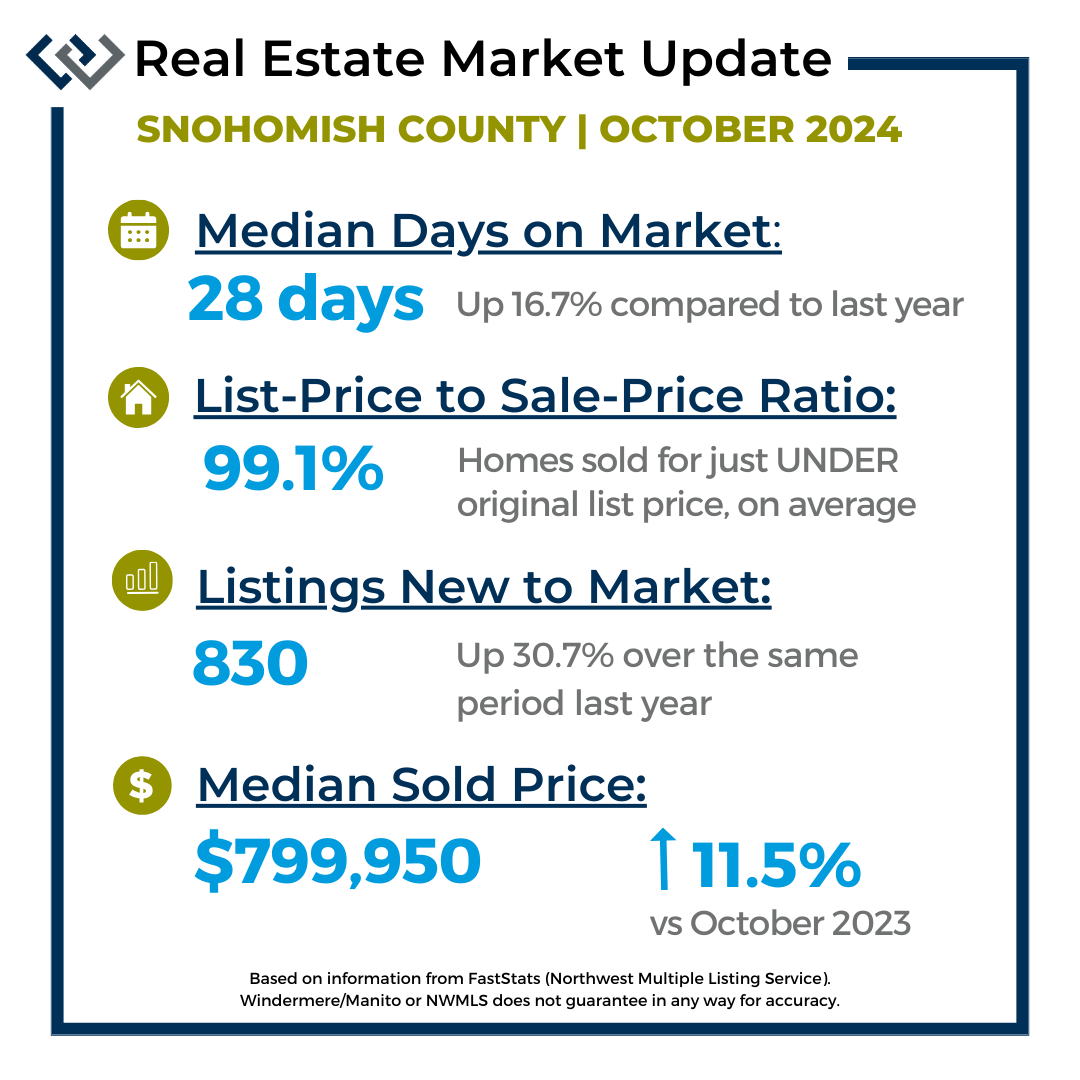
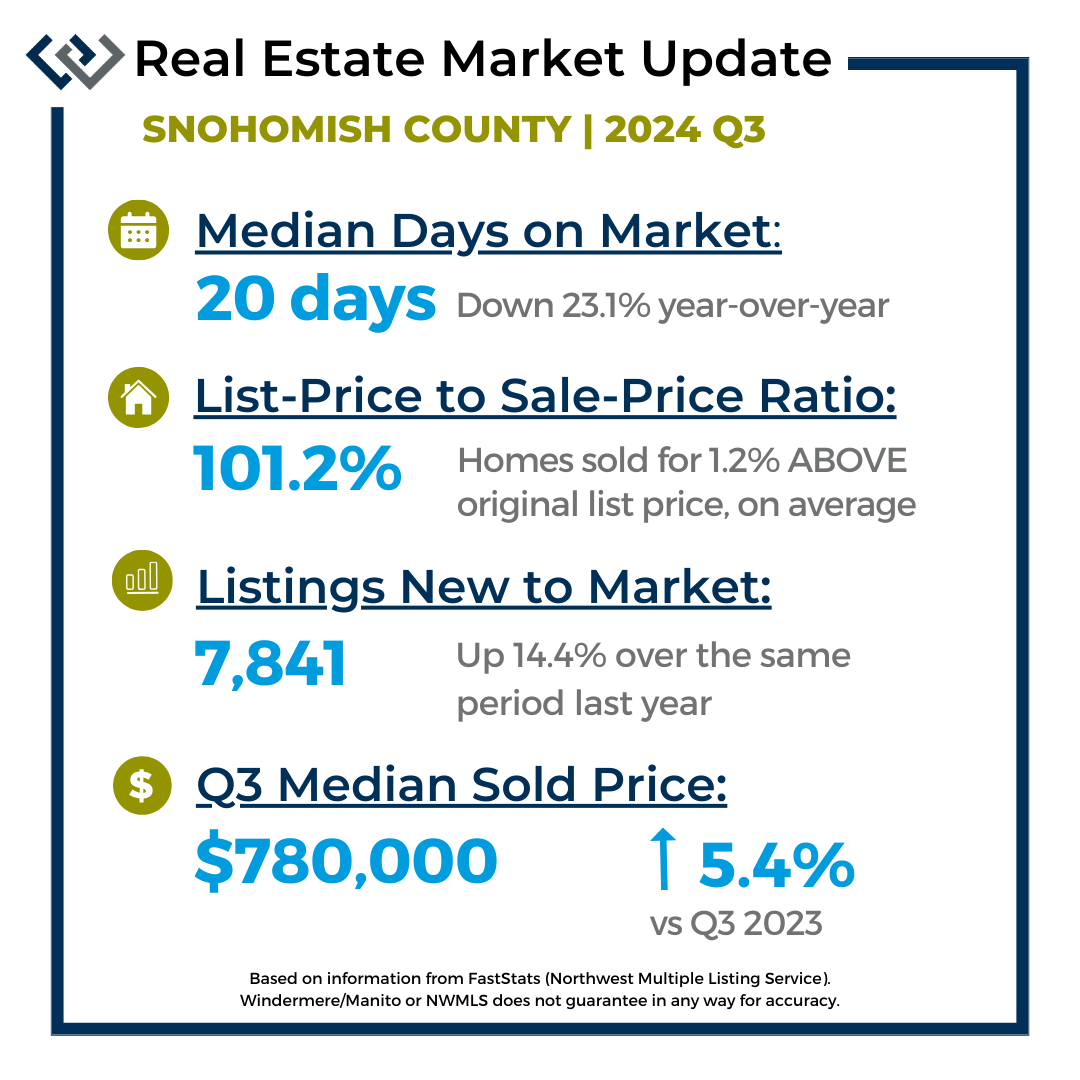
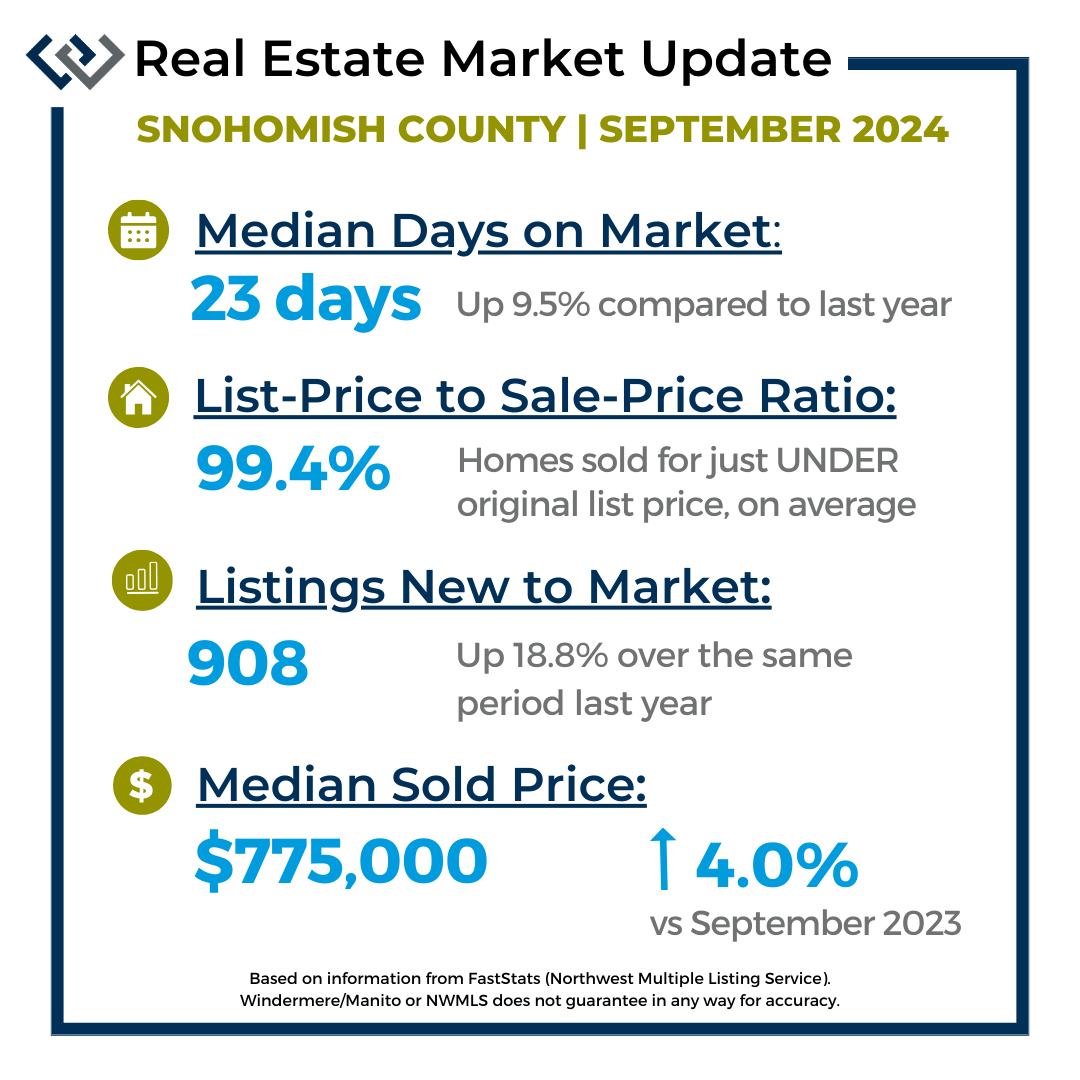
These data points tell part of the story about the residential housing market in Snohomish County - but there are interesting points behind the figures.
At this point, we have more homes on the market than were sold (closed) in January. Some of the 683 are "pending" sale and aren't actively on the market. Overall, the market is moving albeit with a bit longer days on market for many homes.
Bottom line: The Snohomish County residential housing market is still active. Homes are, on average, holding and gaining in value, year-over-year.
Want more market data? head to my website and check out "Market Updates" tab. Or, head to my homepage, subscribe to Market Pulse - this will deliver a custom report to your mailbox once a month (no other SPAM, I promise). OR - reach out to me. I'm happy to meet and break down meaningful information for you.


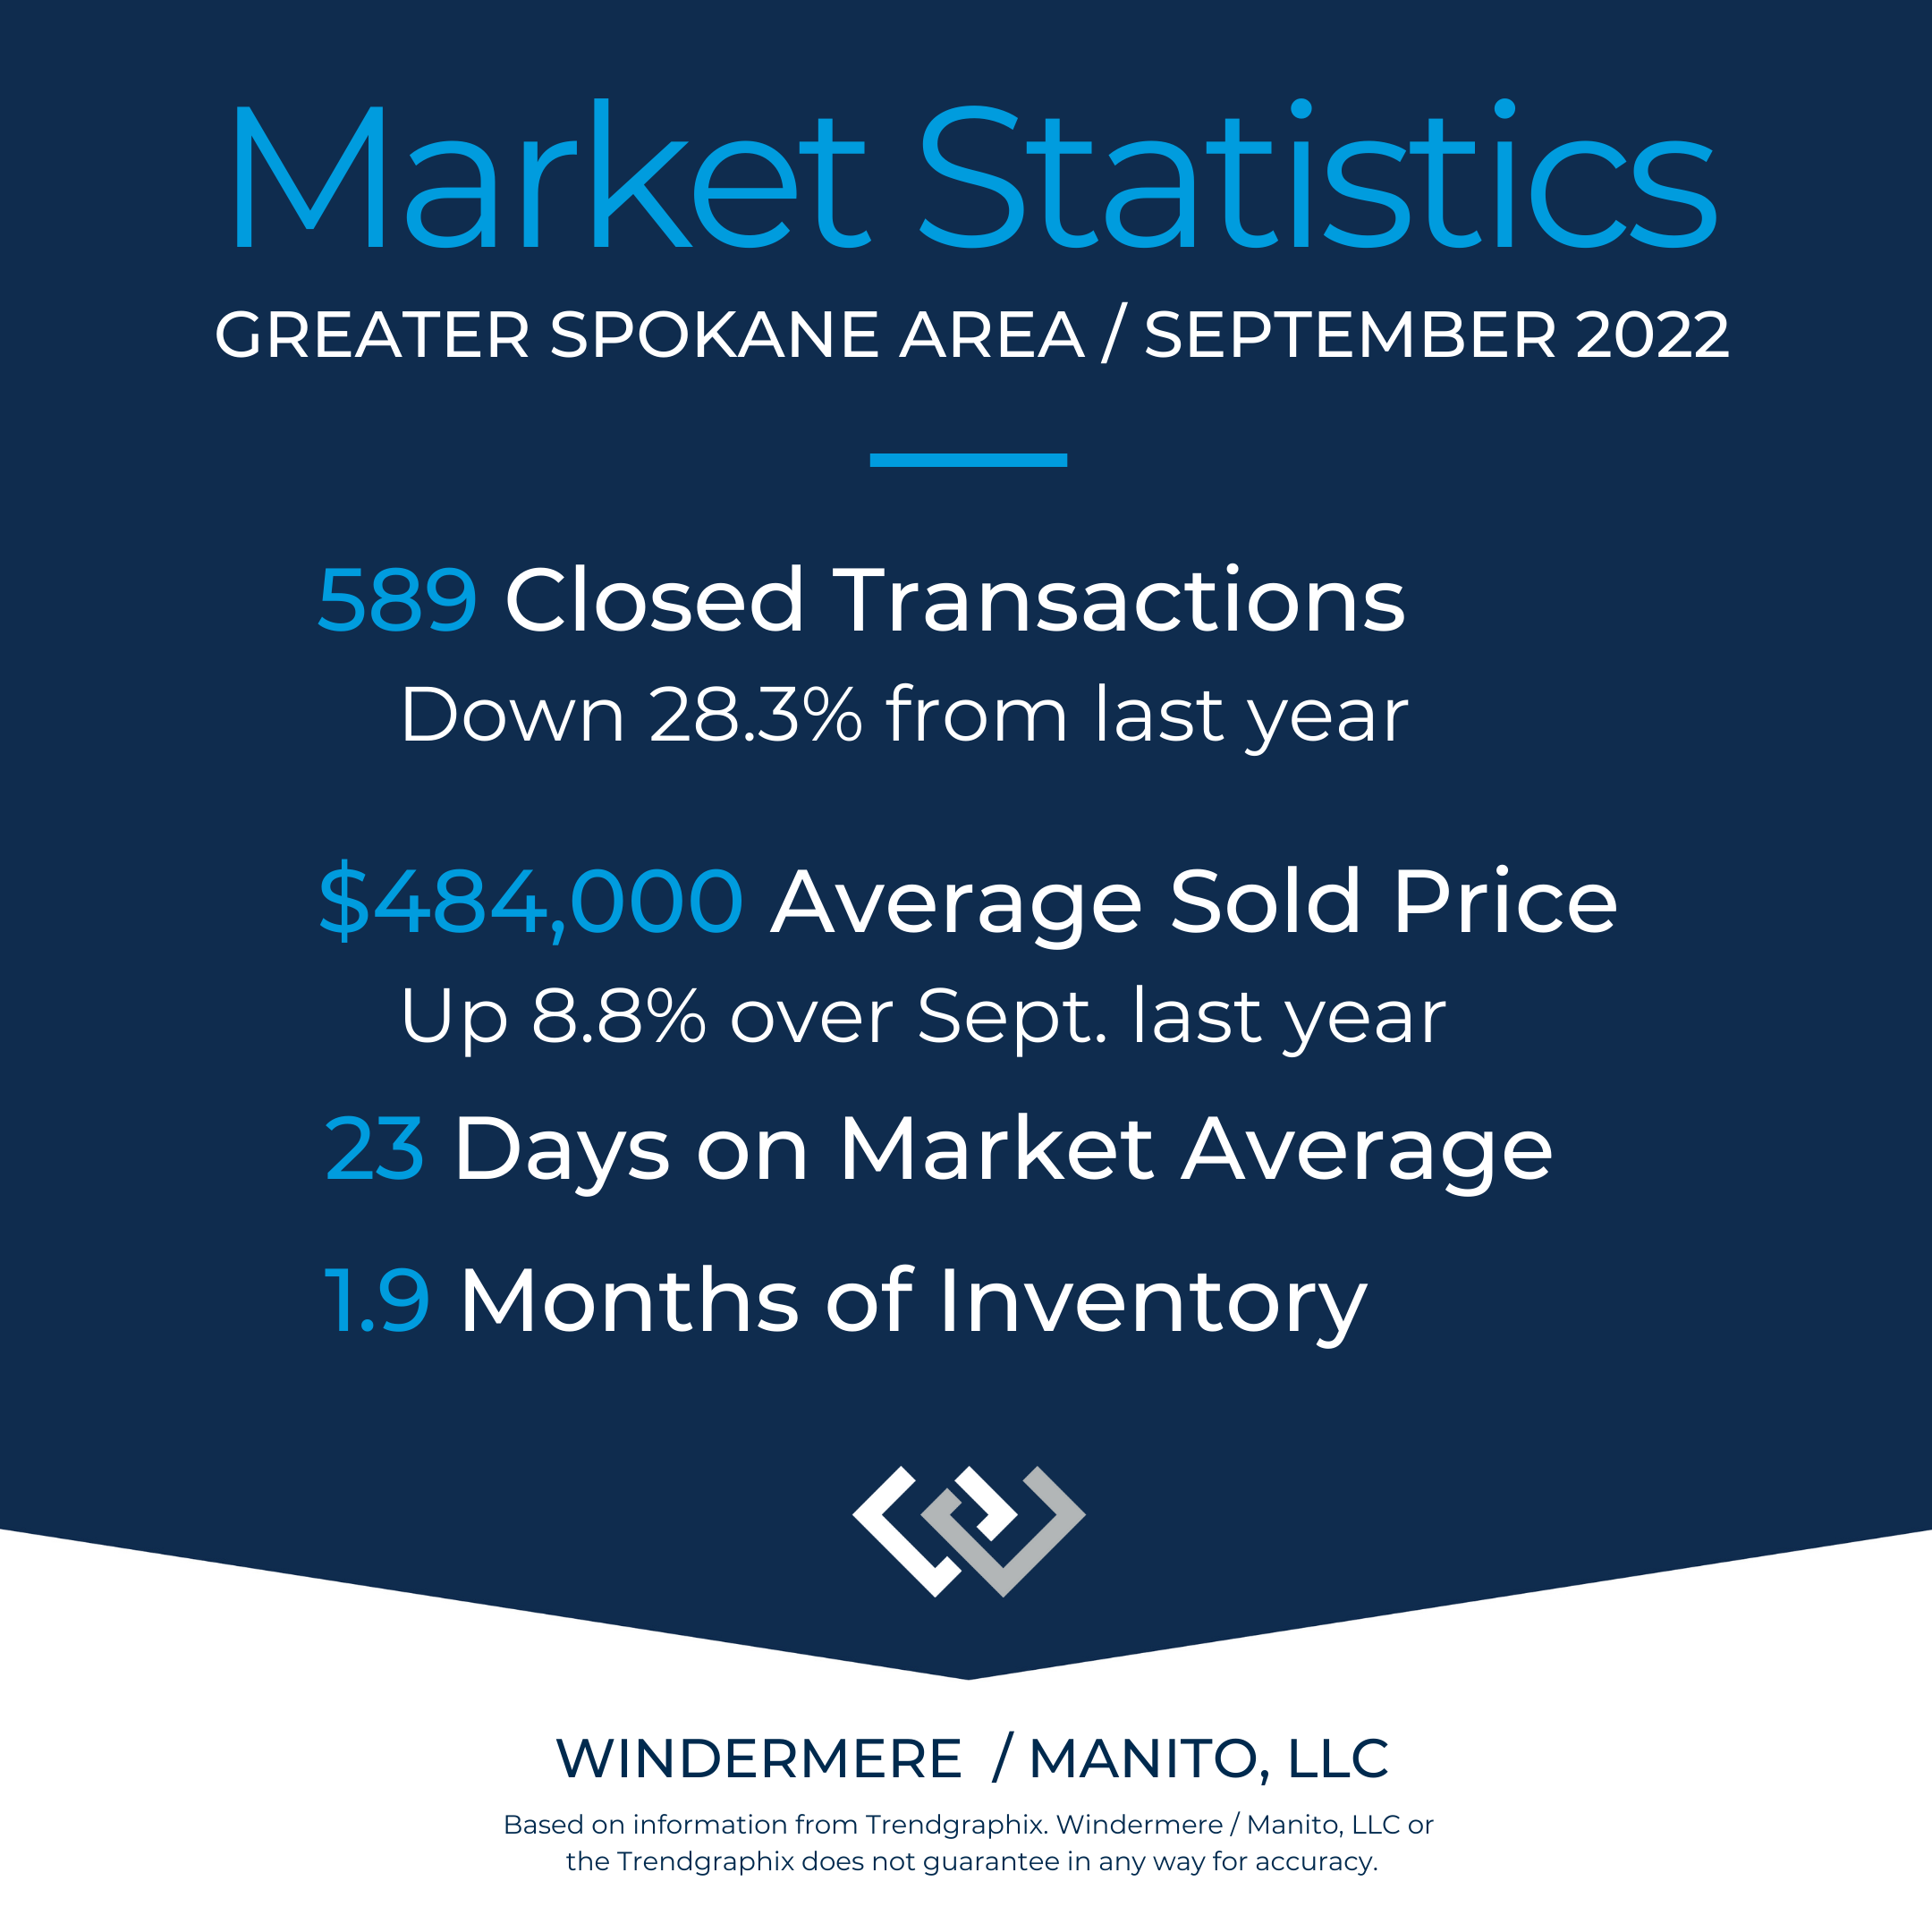
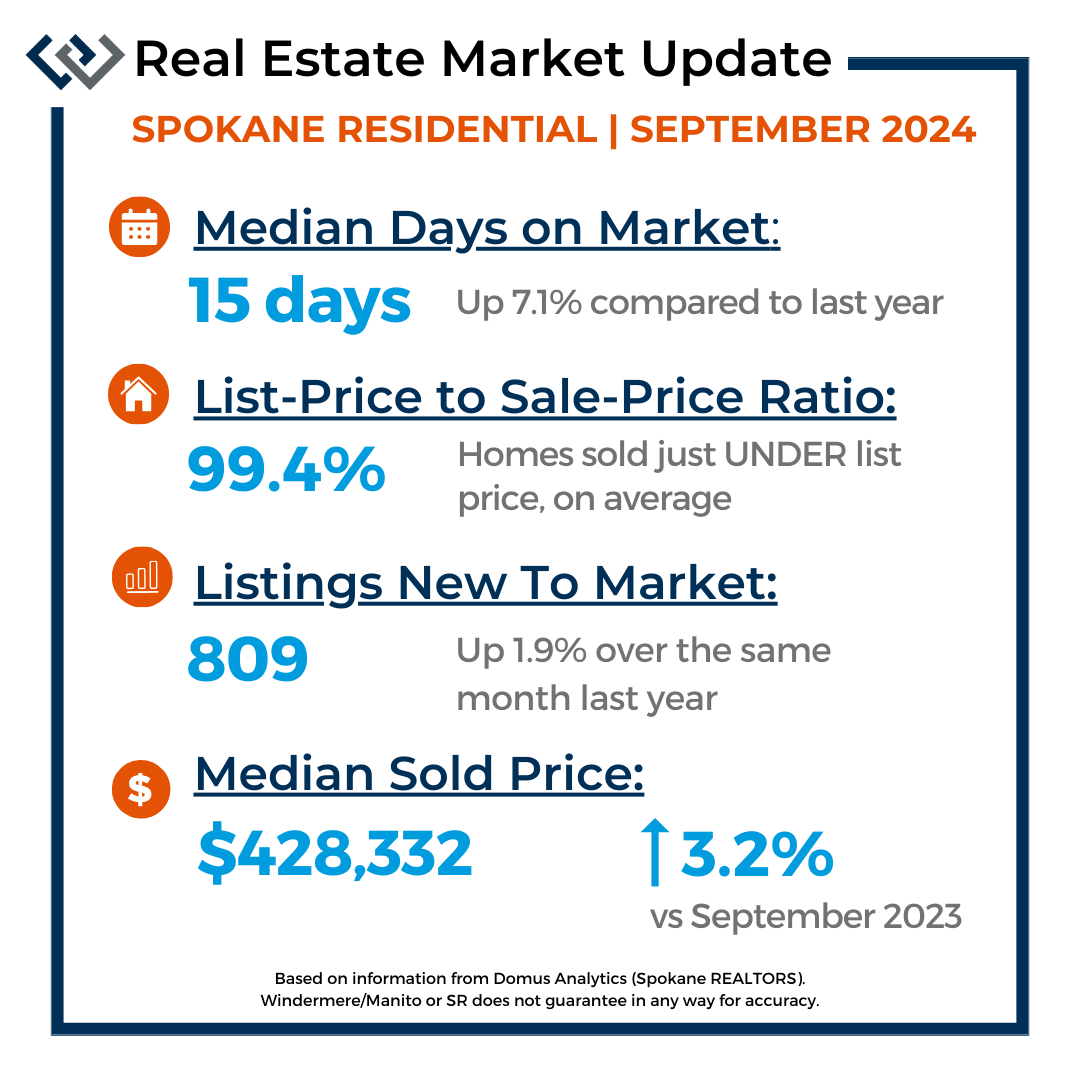
Breaking Down the Numbers | Spokane-Area, January 2025
Data tells a story, and as you probably know - there is always more than meets the eye.
Homes are selling, on average, pretty much right at list price. Yet, median sold prices for January were notably lower than those from December 2024 (about $30k lower). This doesn't reflect a slump in the market - it reflects which section of the market was in most demand in January 2025.
Defying the hopes or predictions of a crash in home values, home prices are holding pretty steady on average.
Bottom line: The Spokane-area housing market is still very active, and homes (on average) are holding their value.
Want more data? Head to my website and checkout the "Market Updates" tab. Or, reach out to me - I'm happy to meet and break down meaningful information for you.
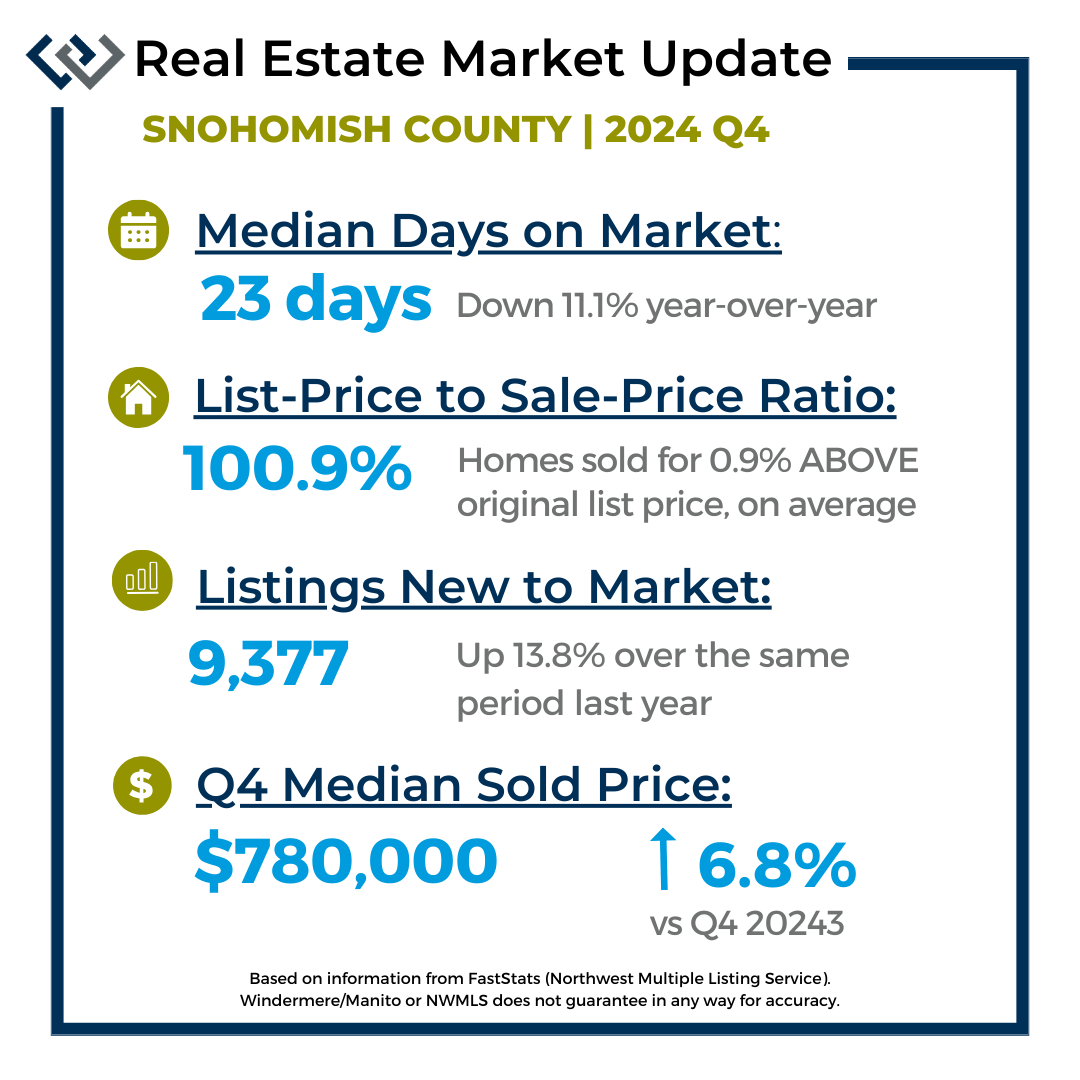







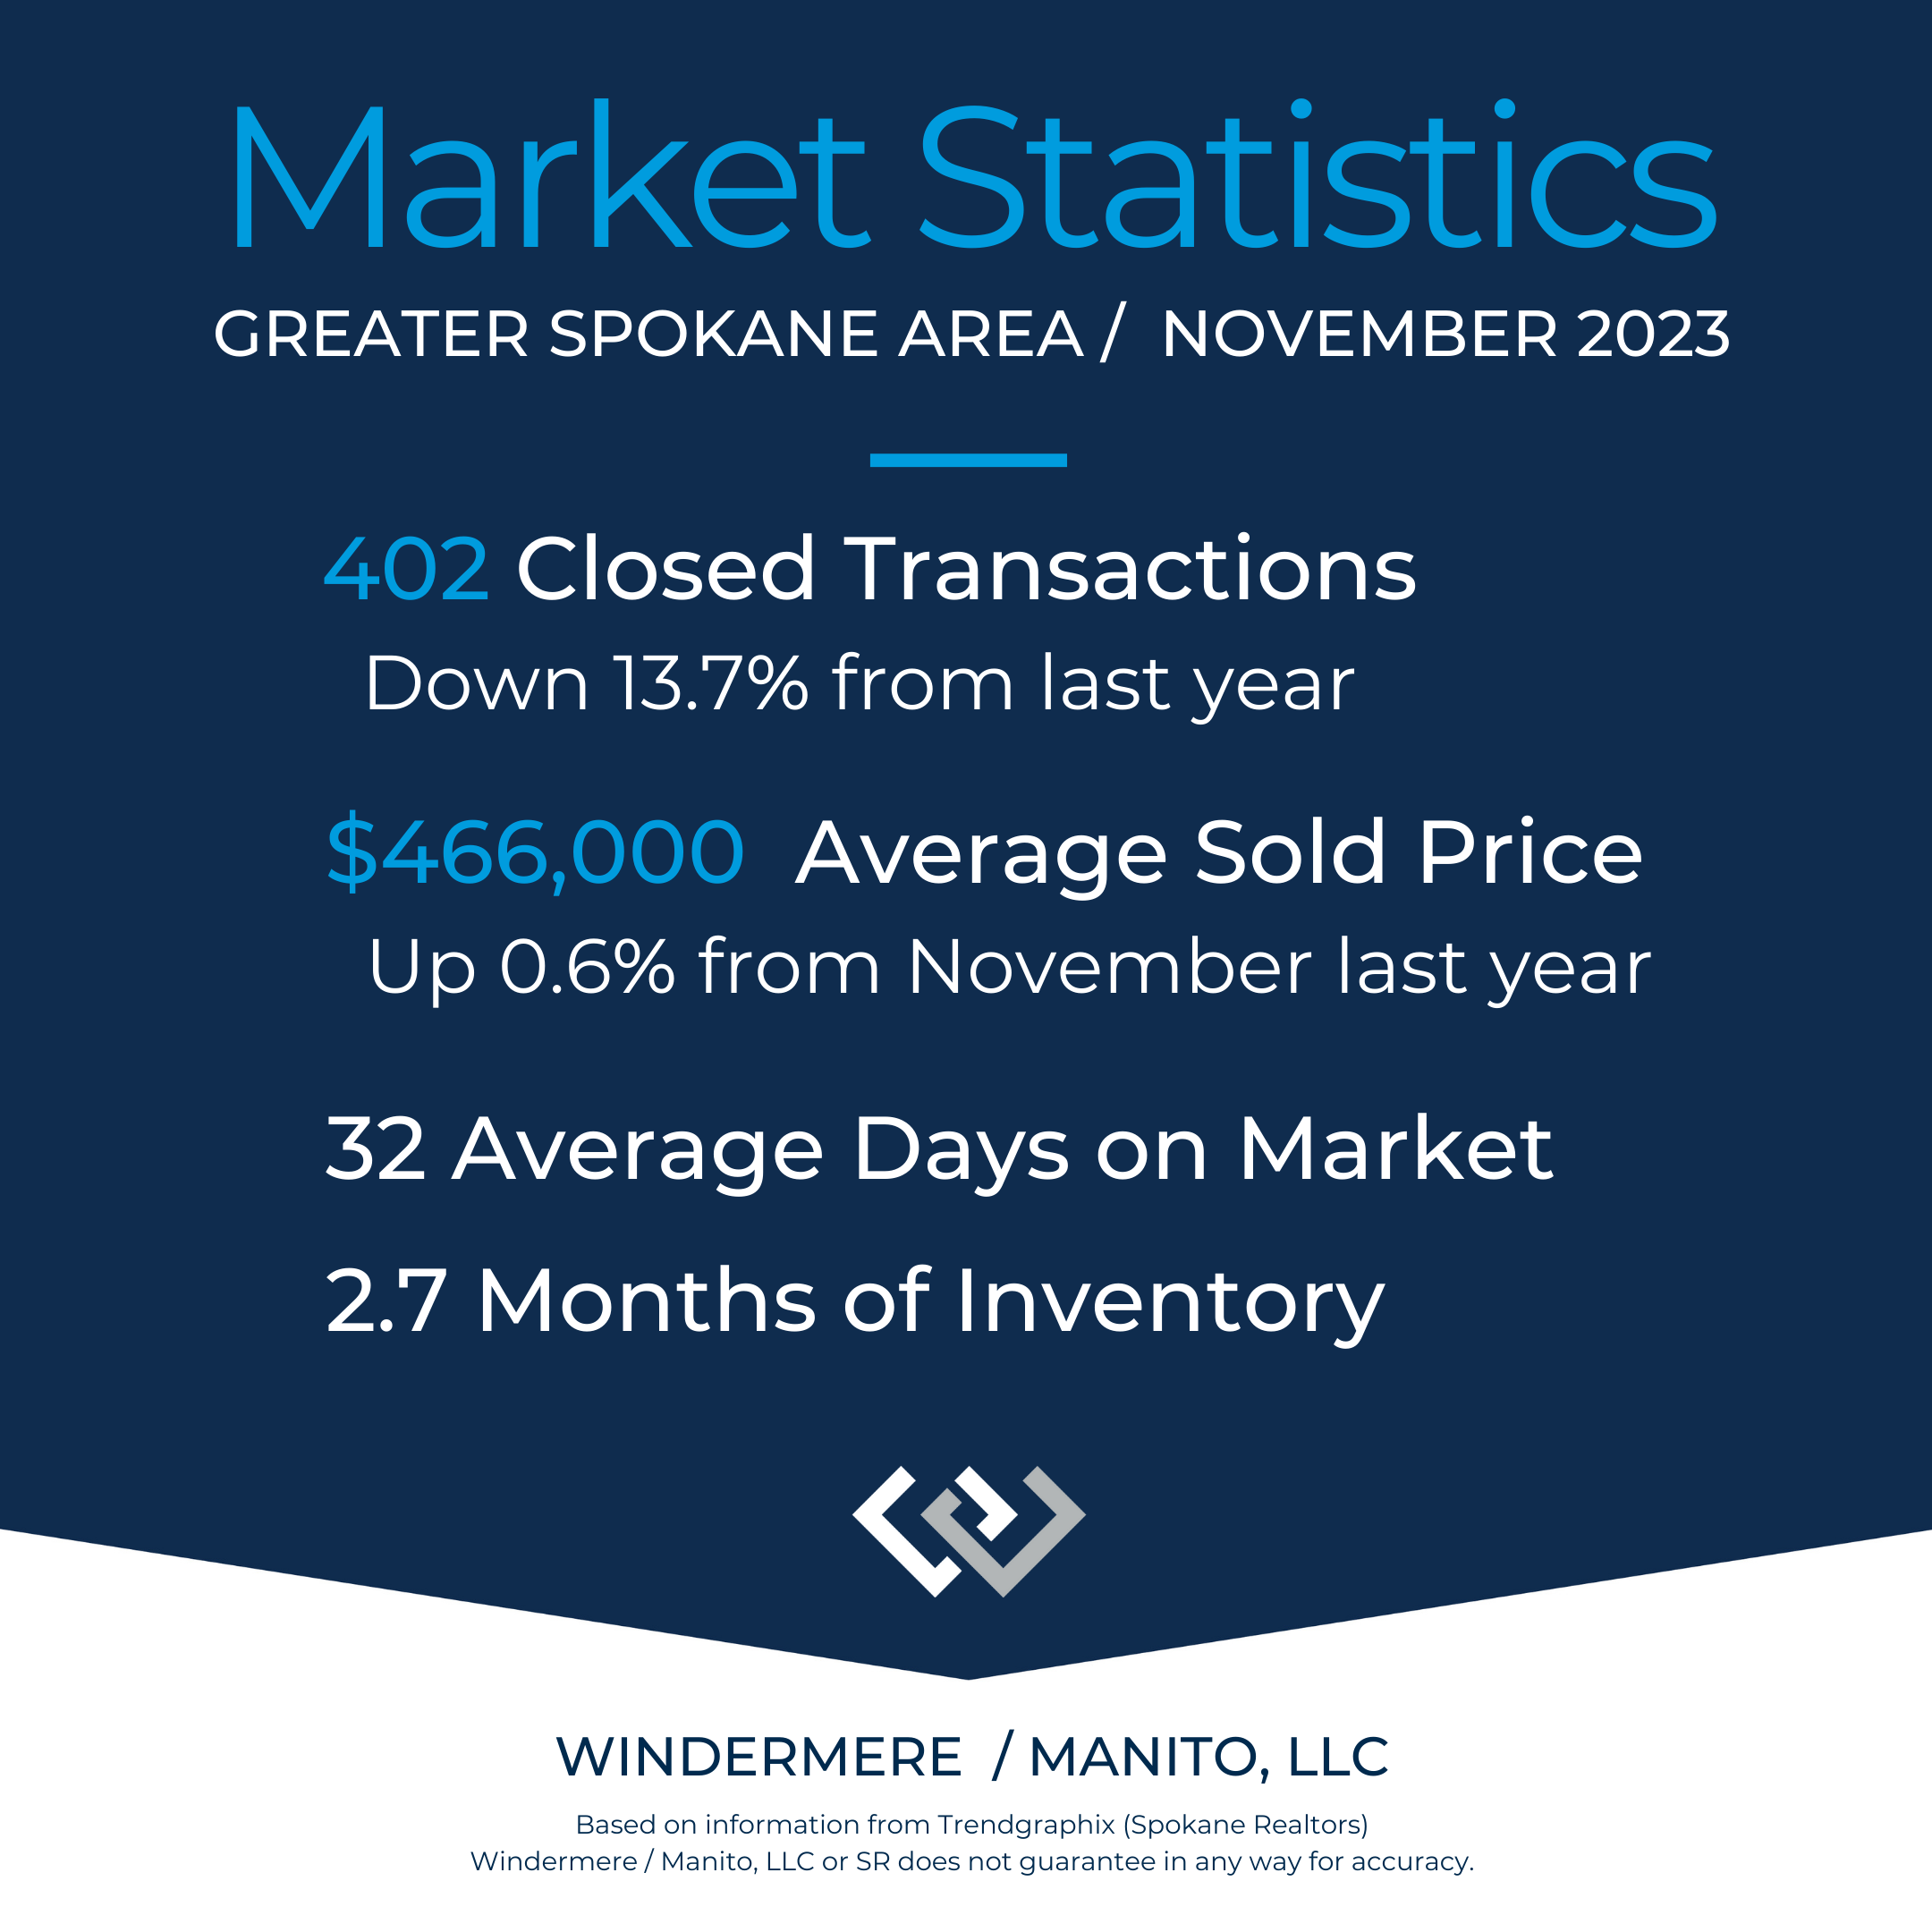
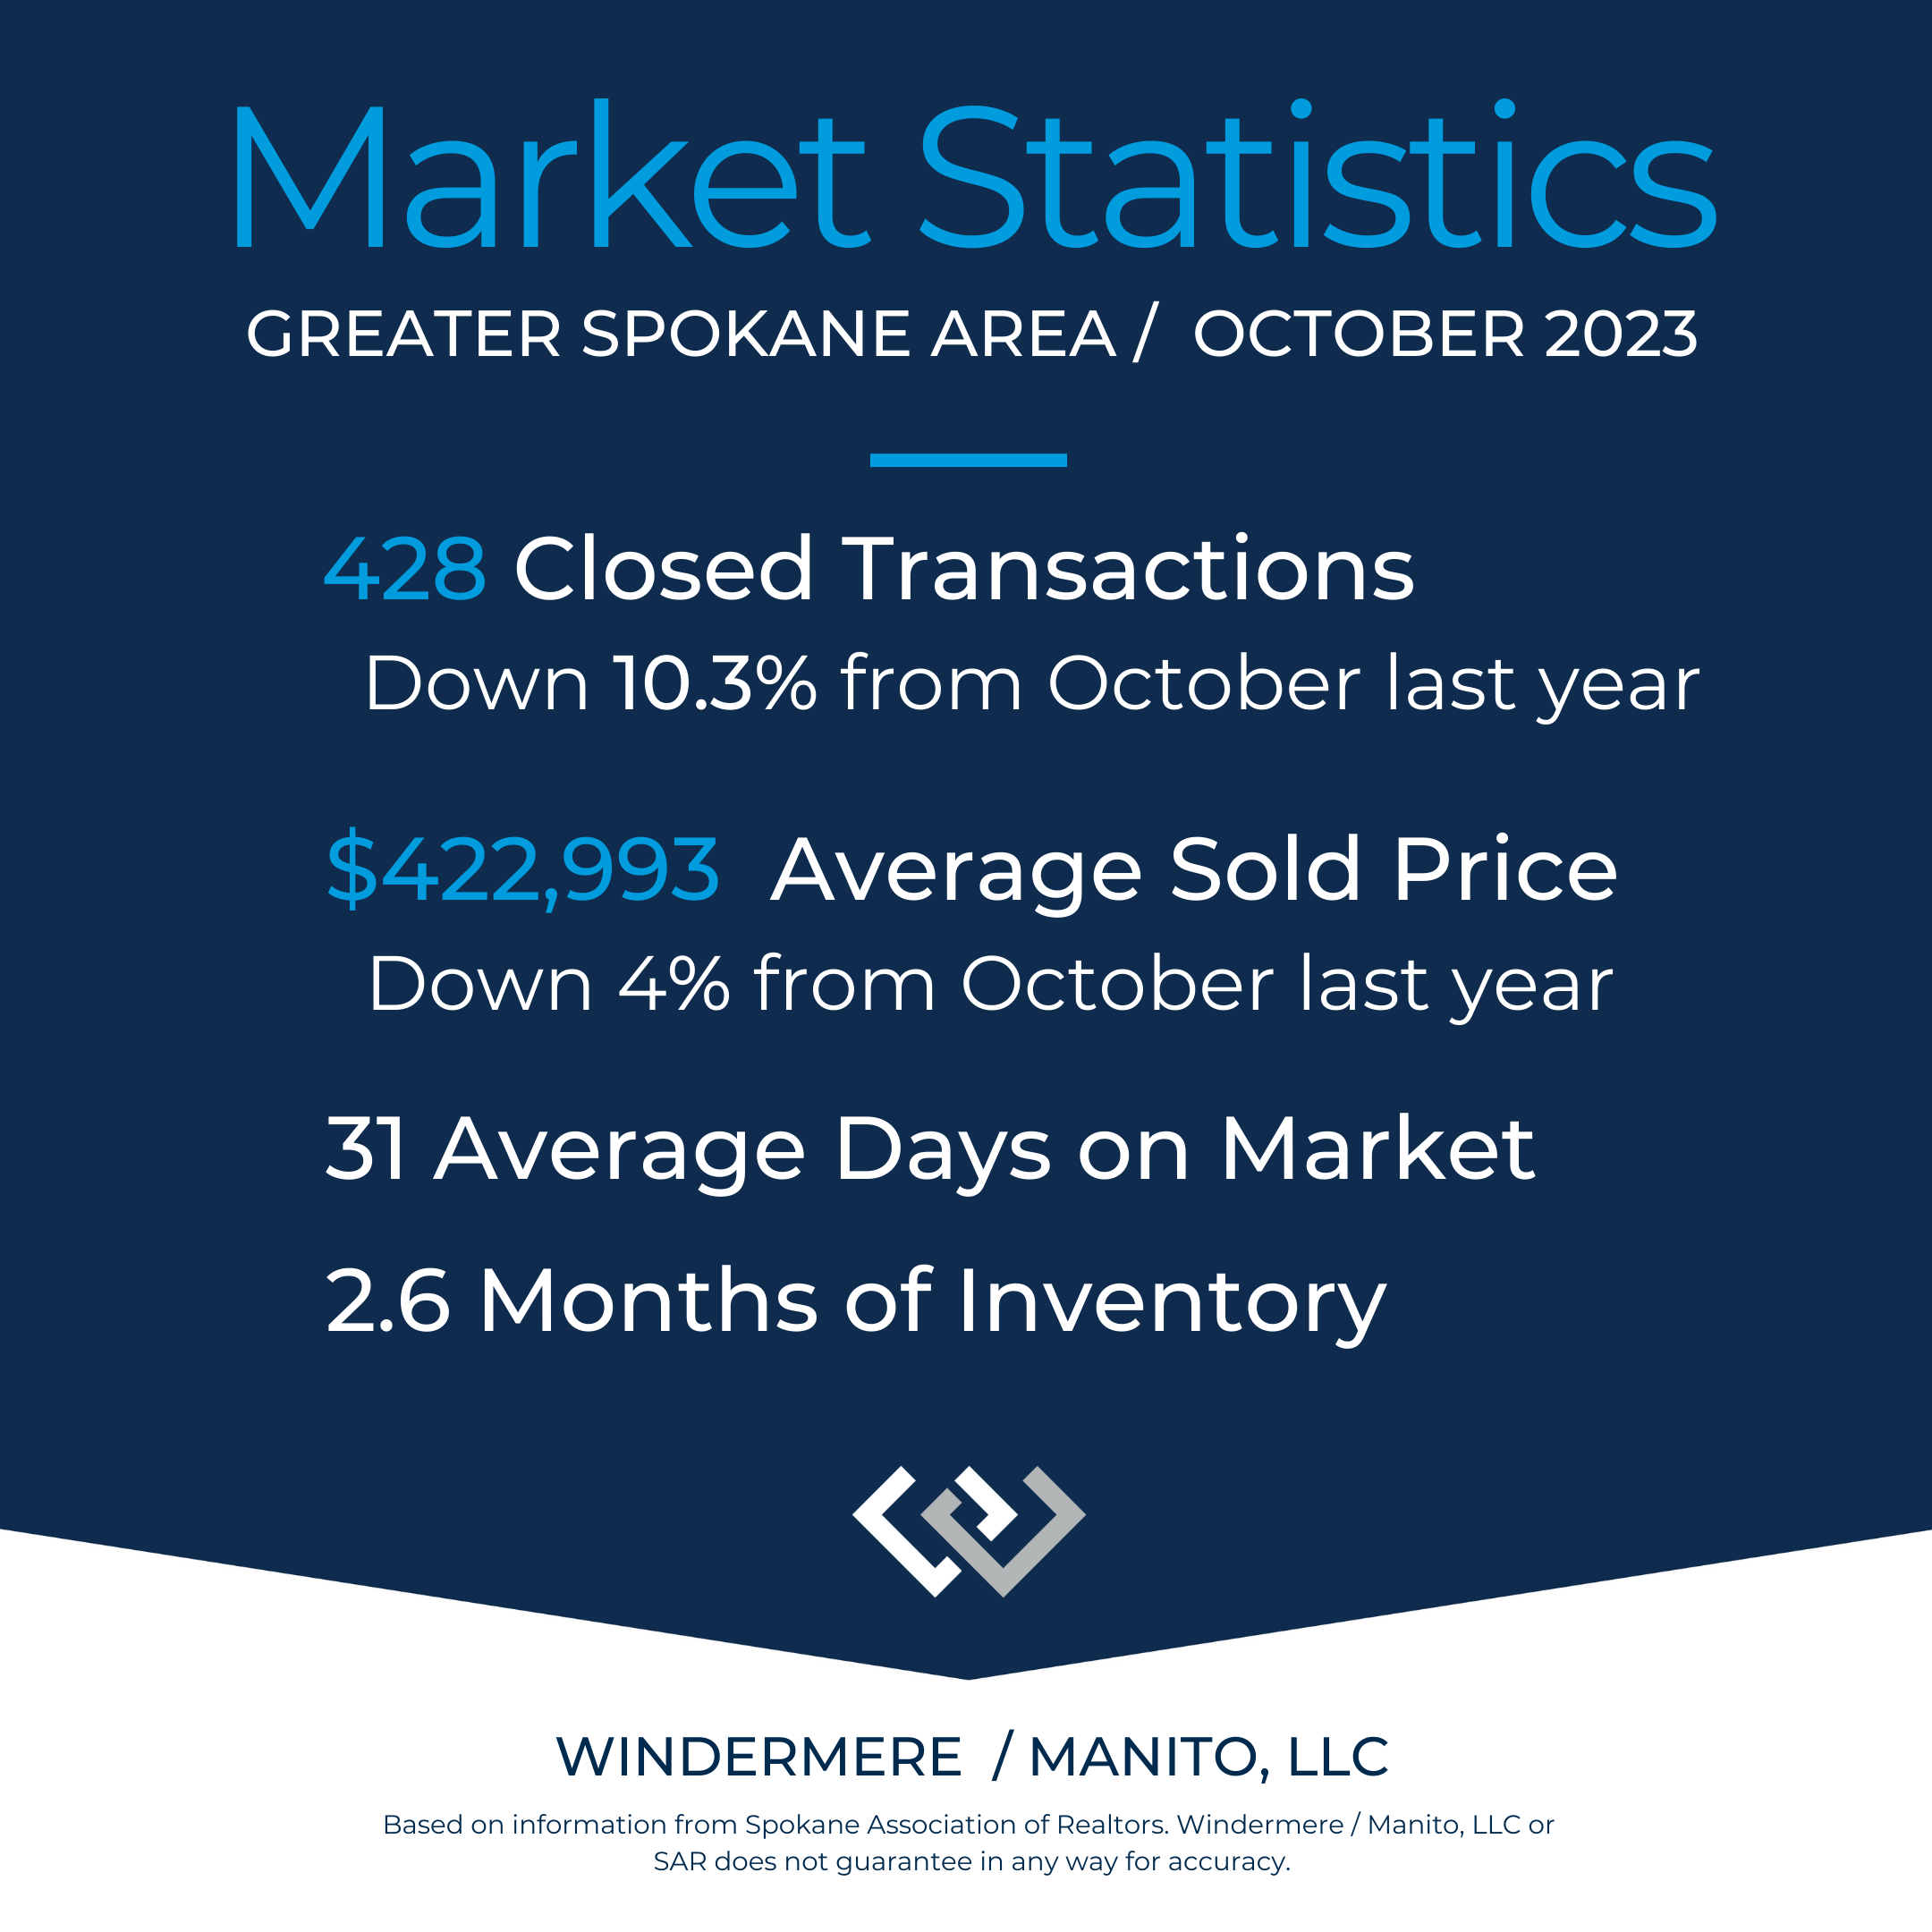
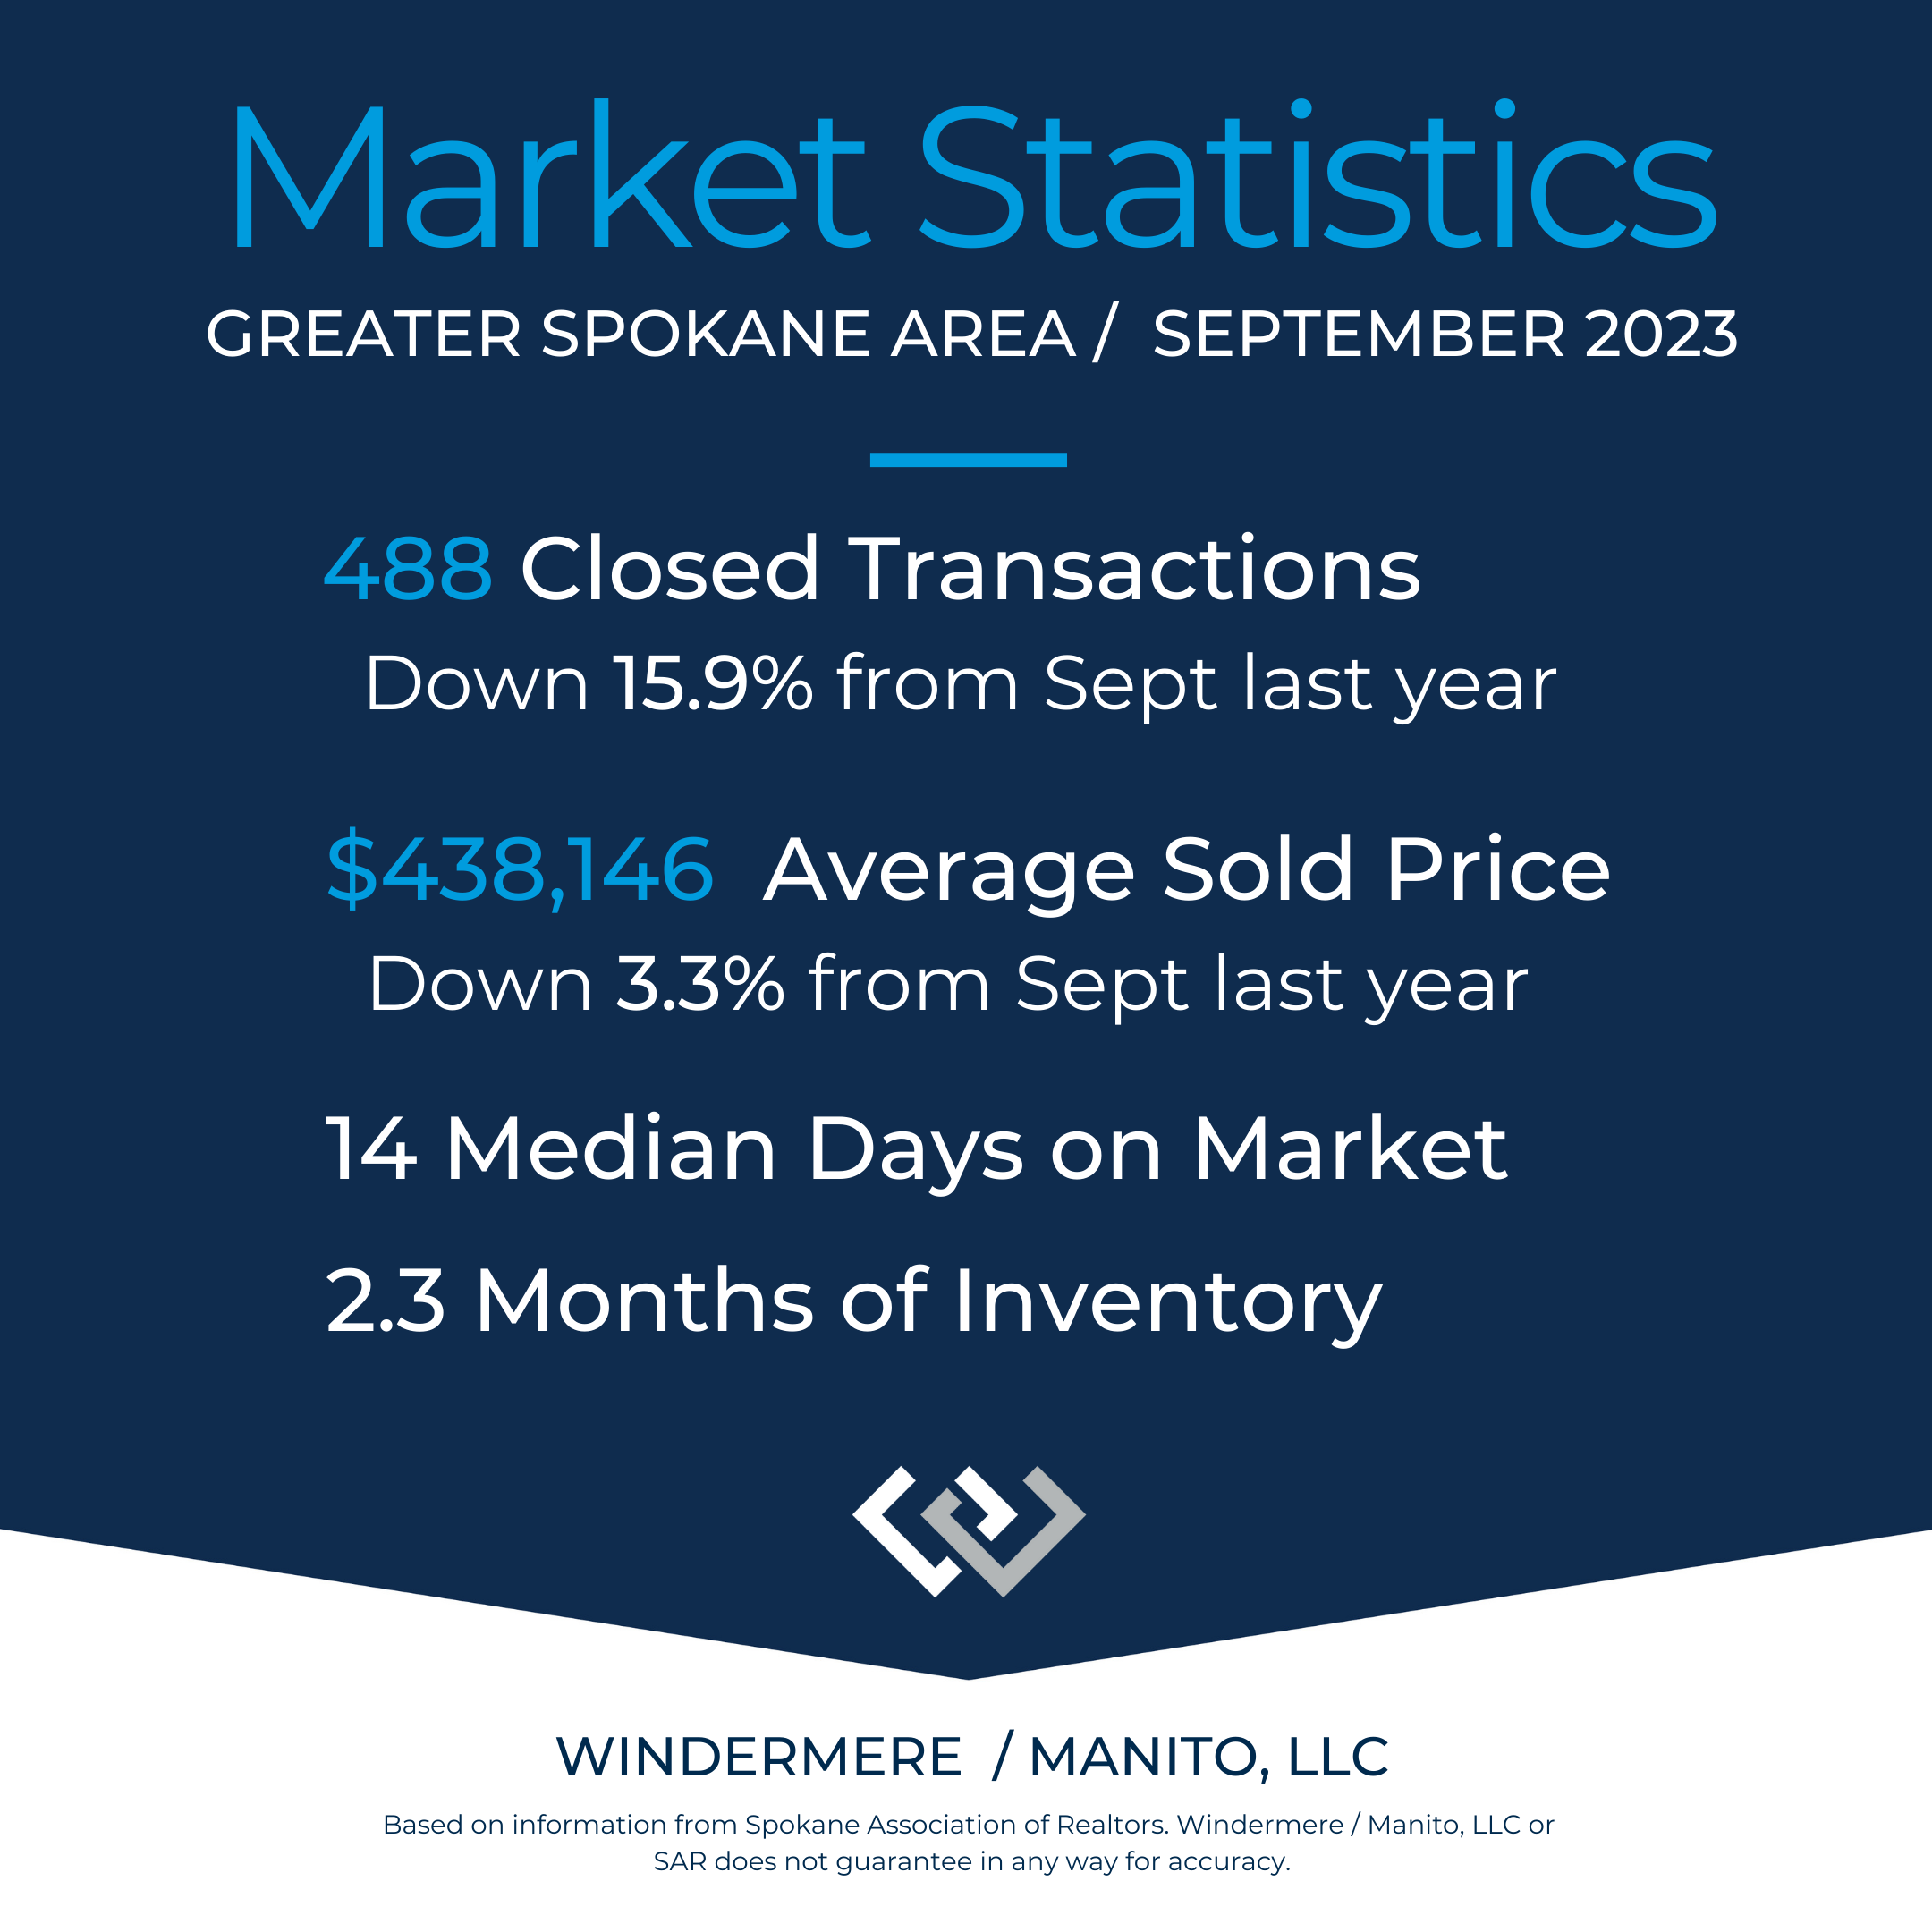
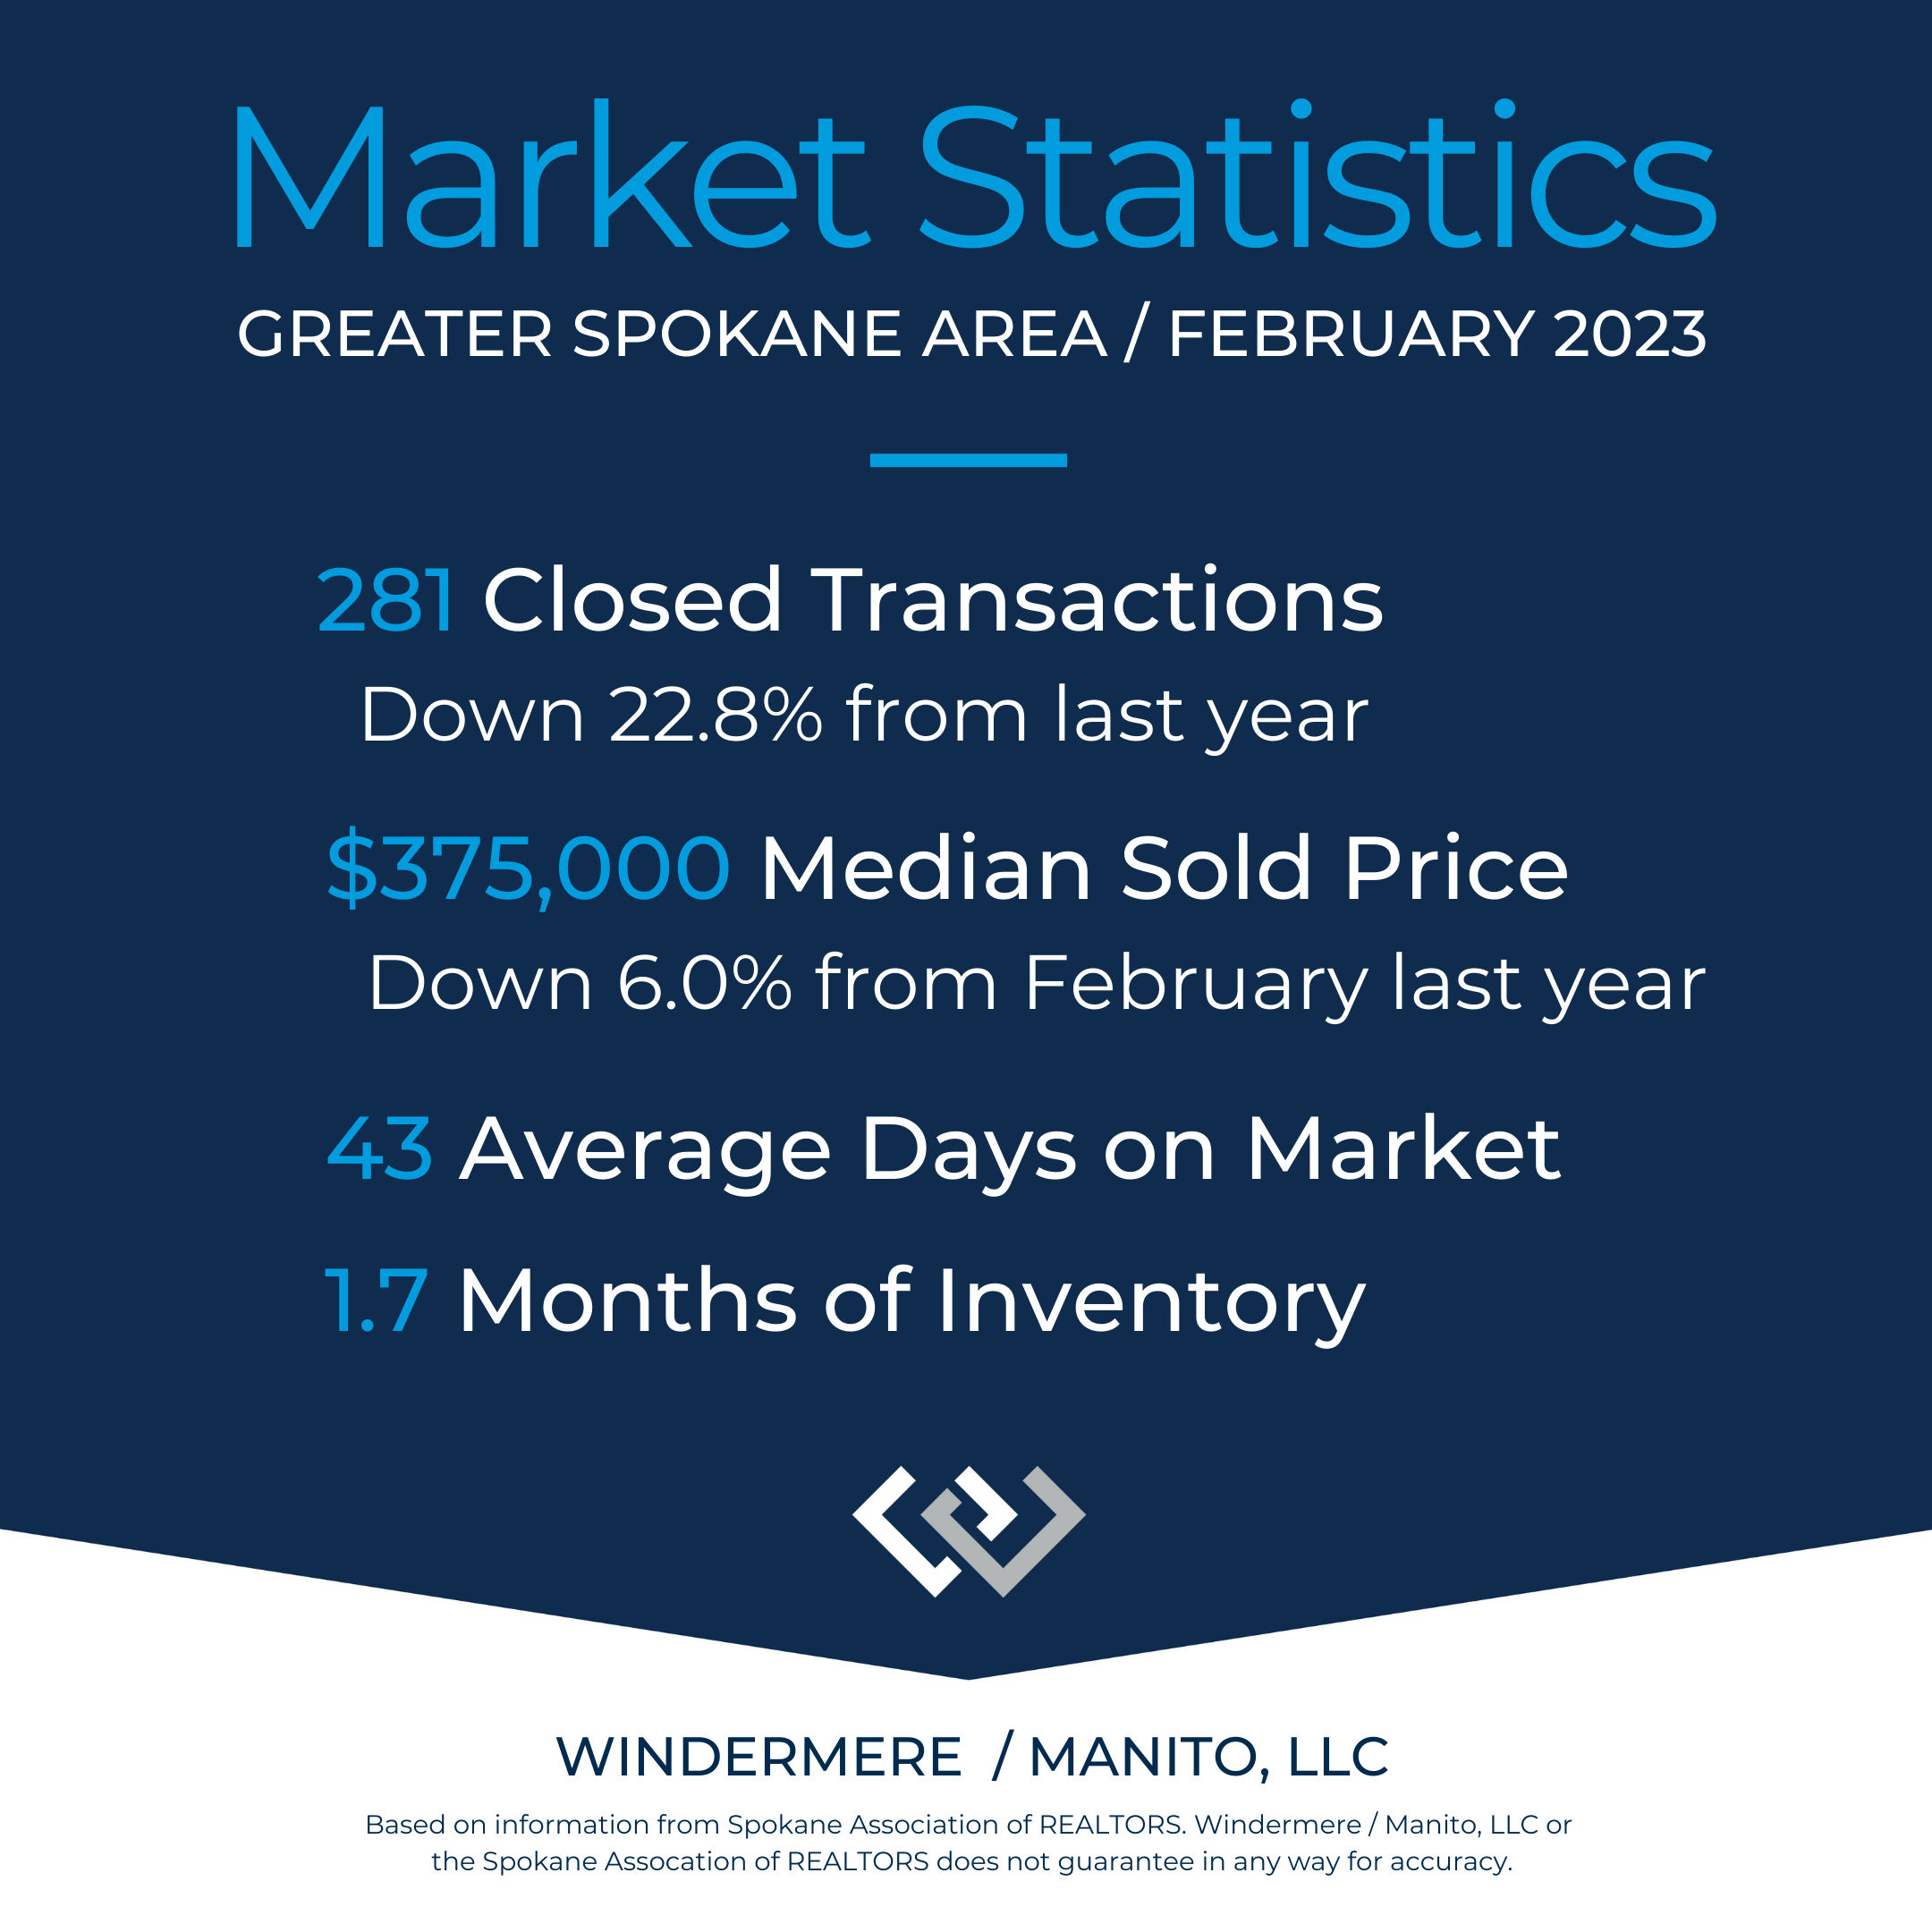
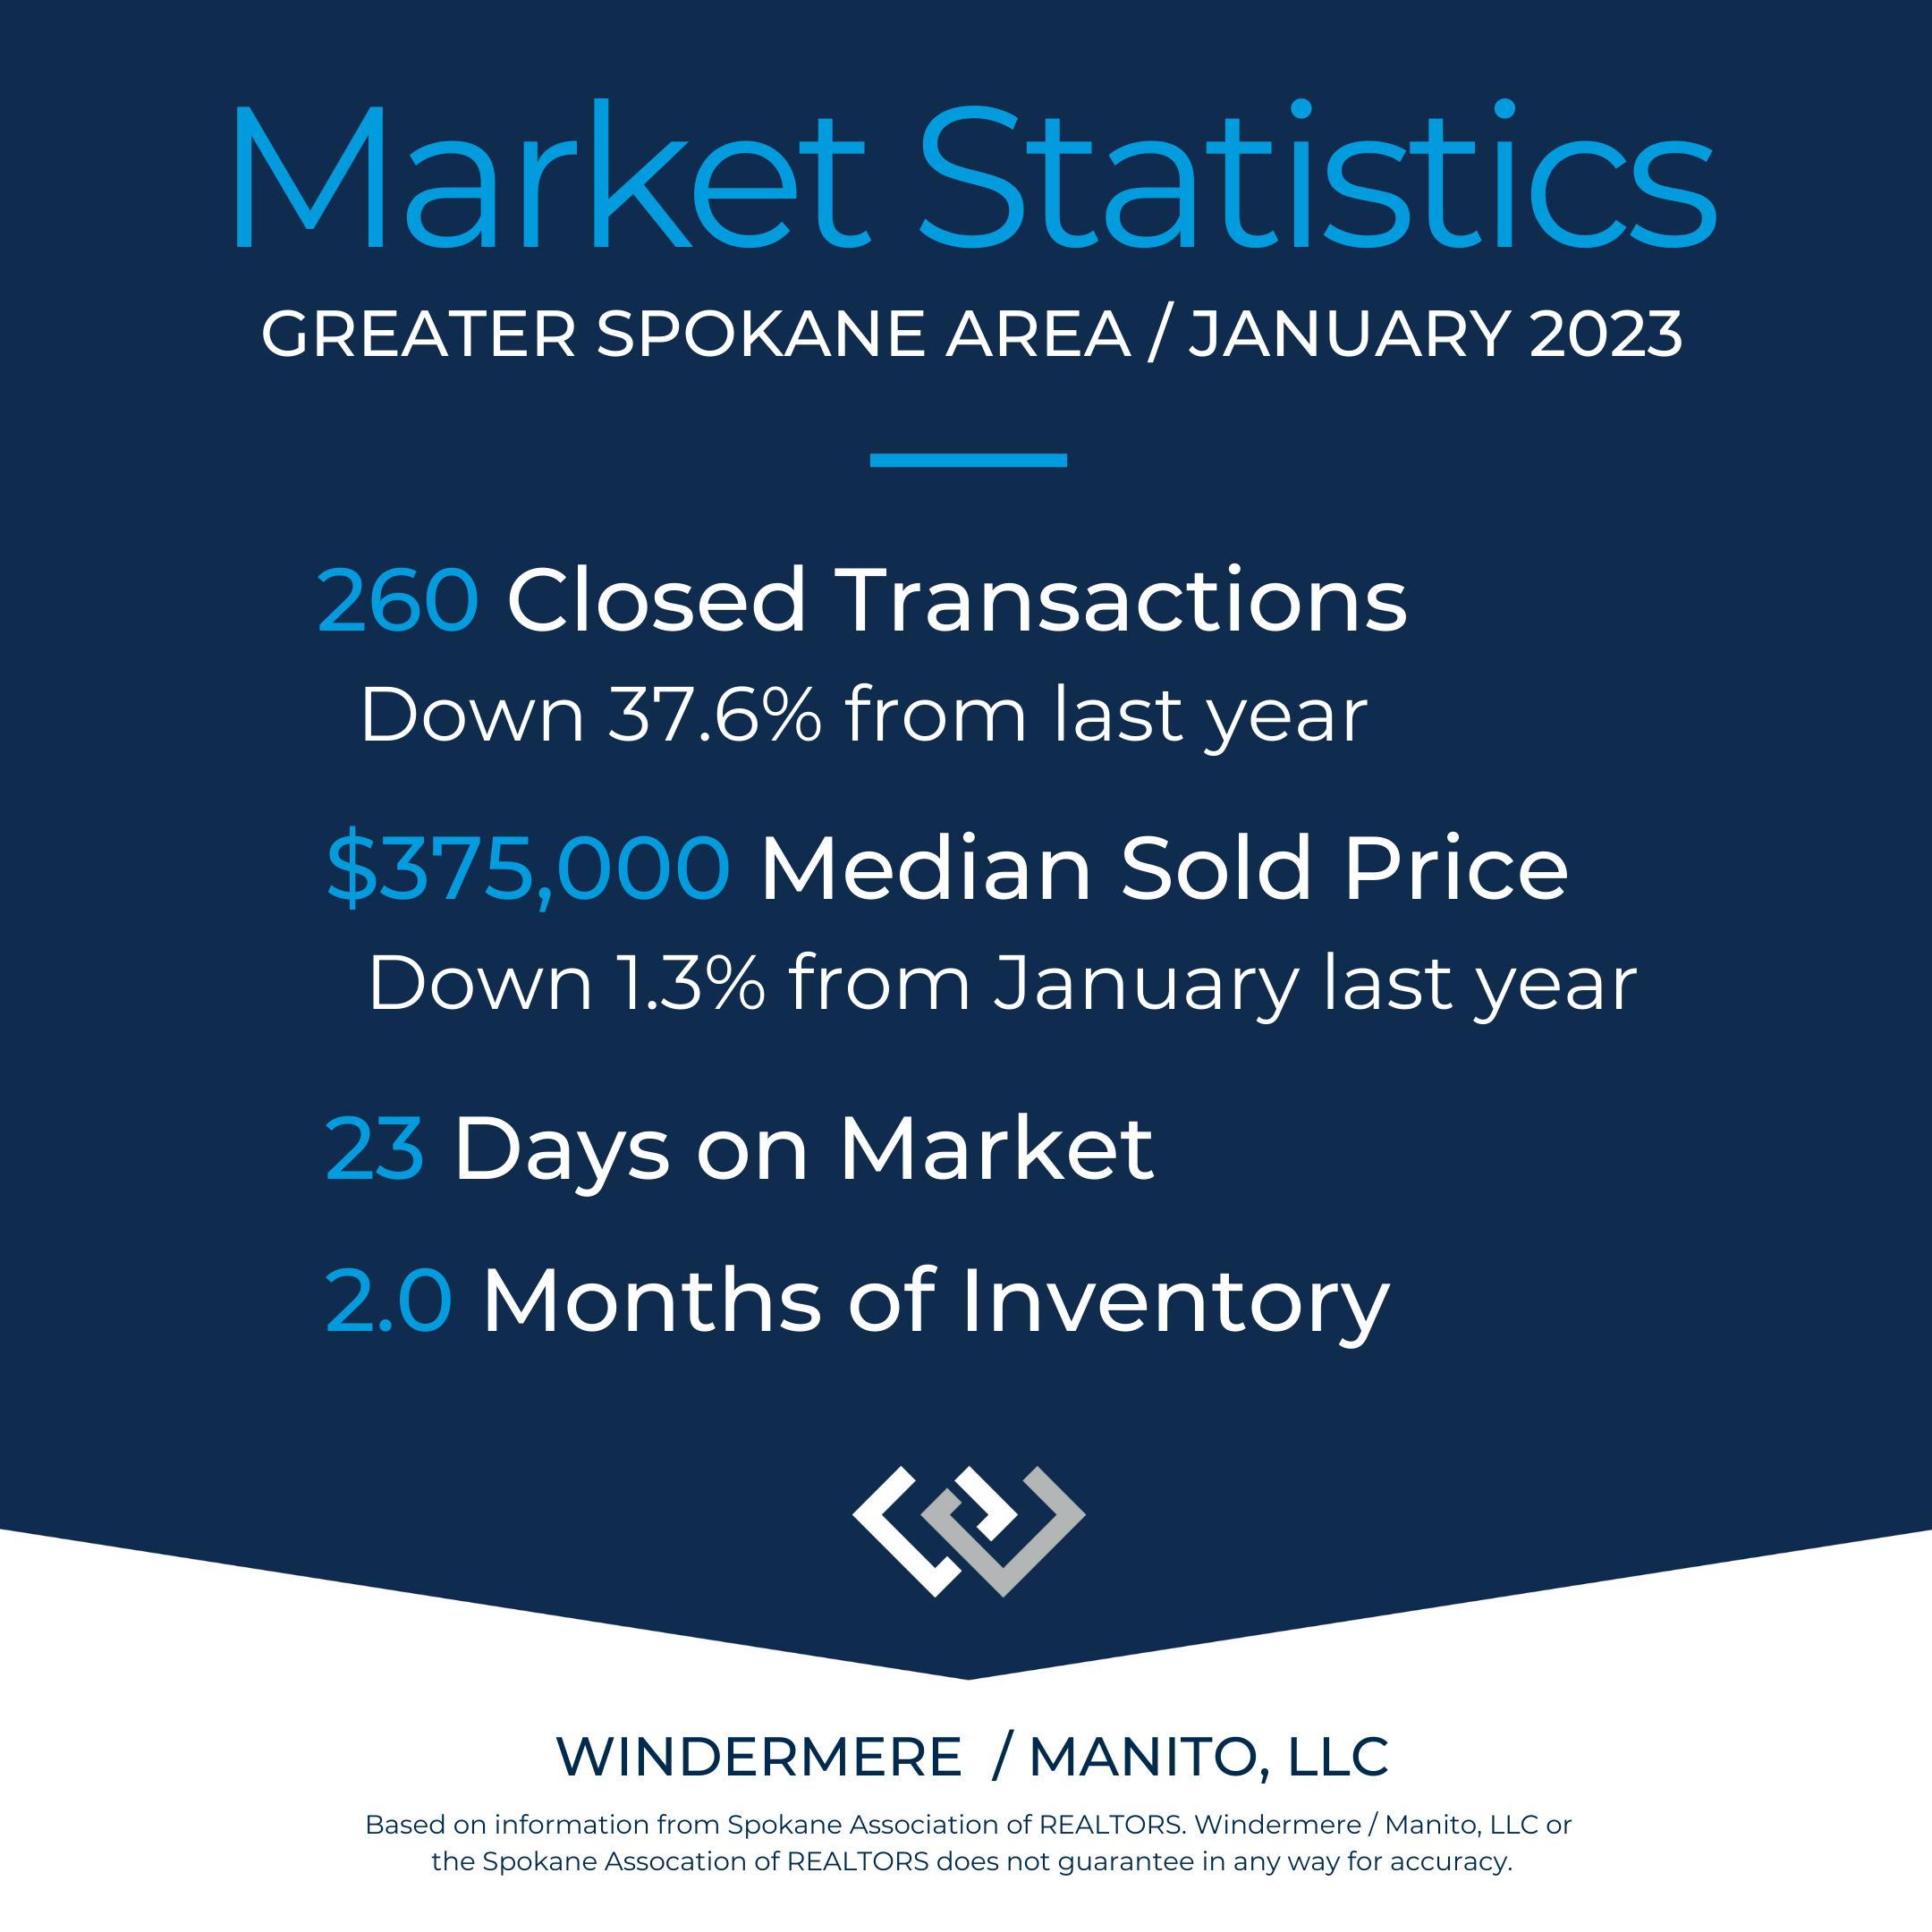
Spokane Market Observations - Q1 2023
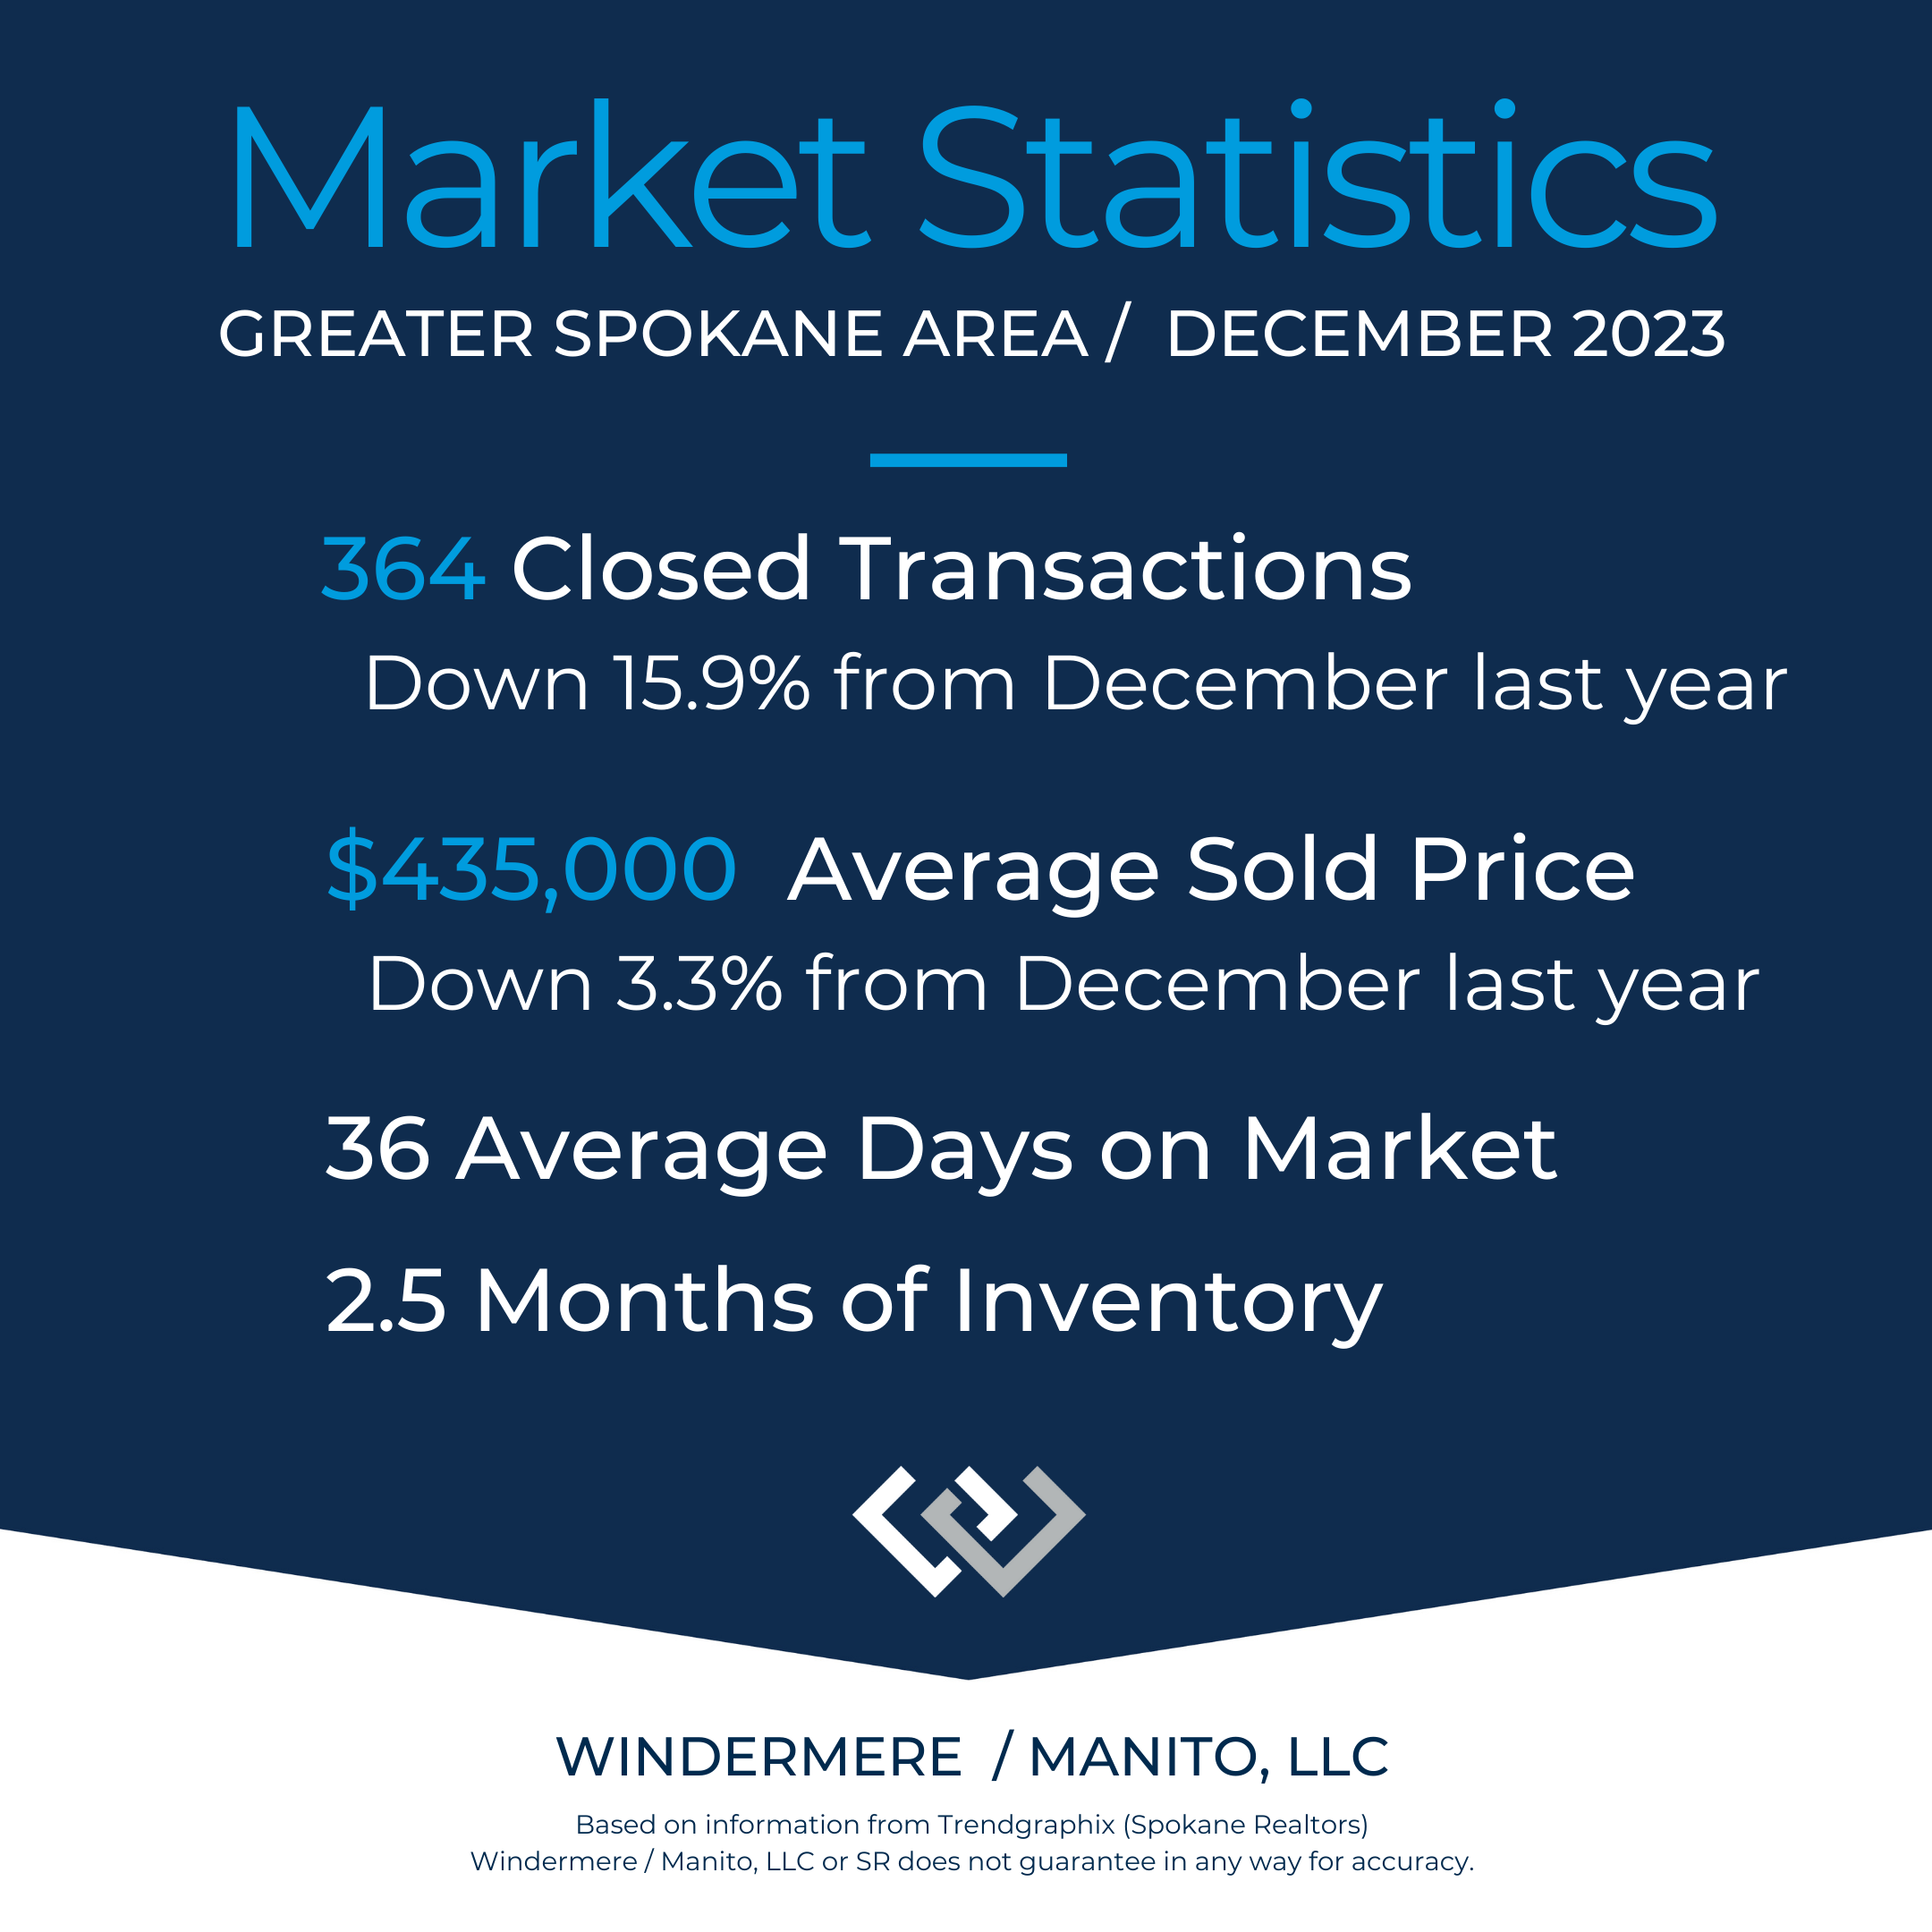
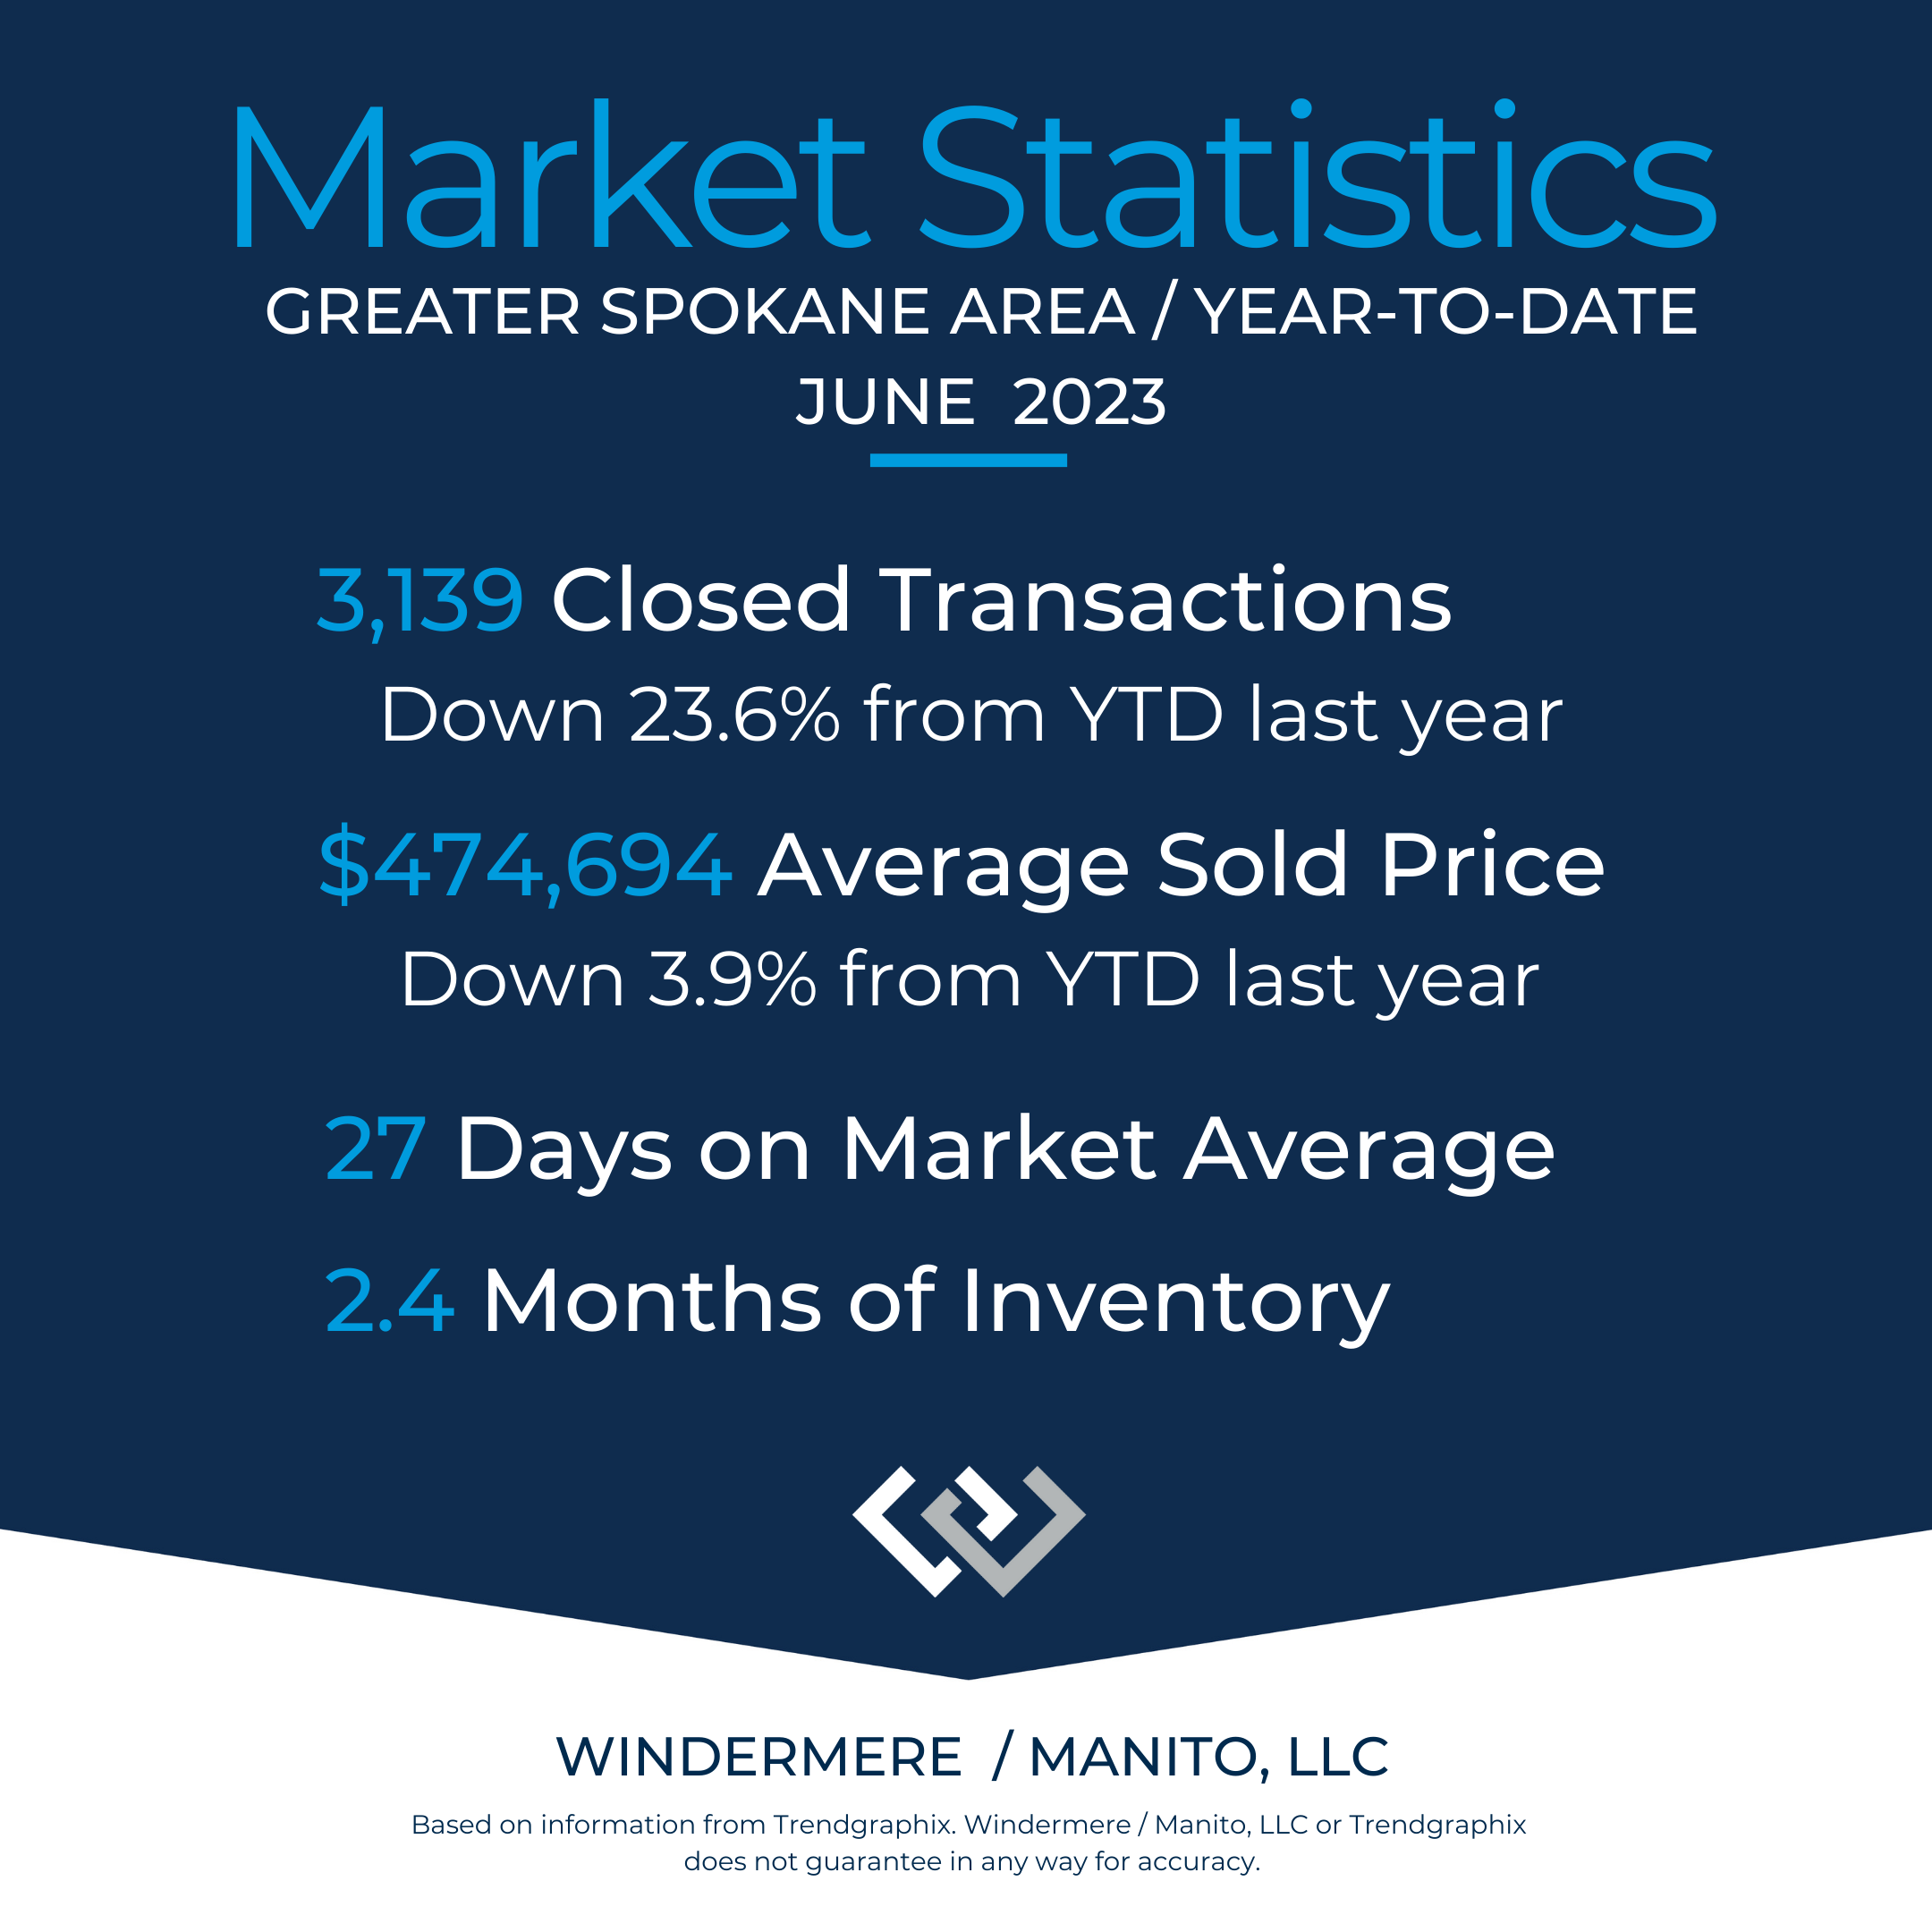
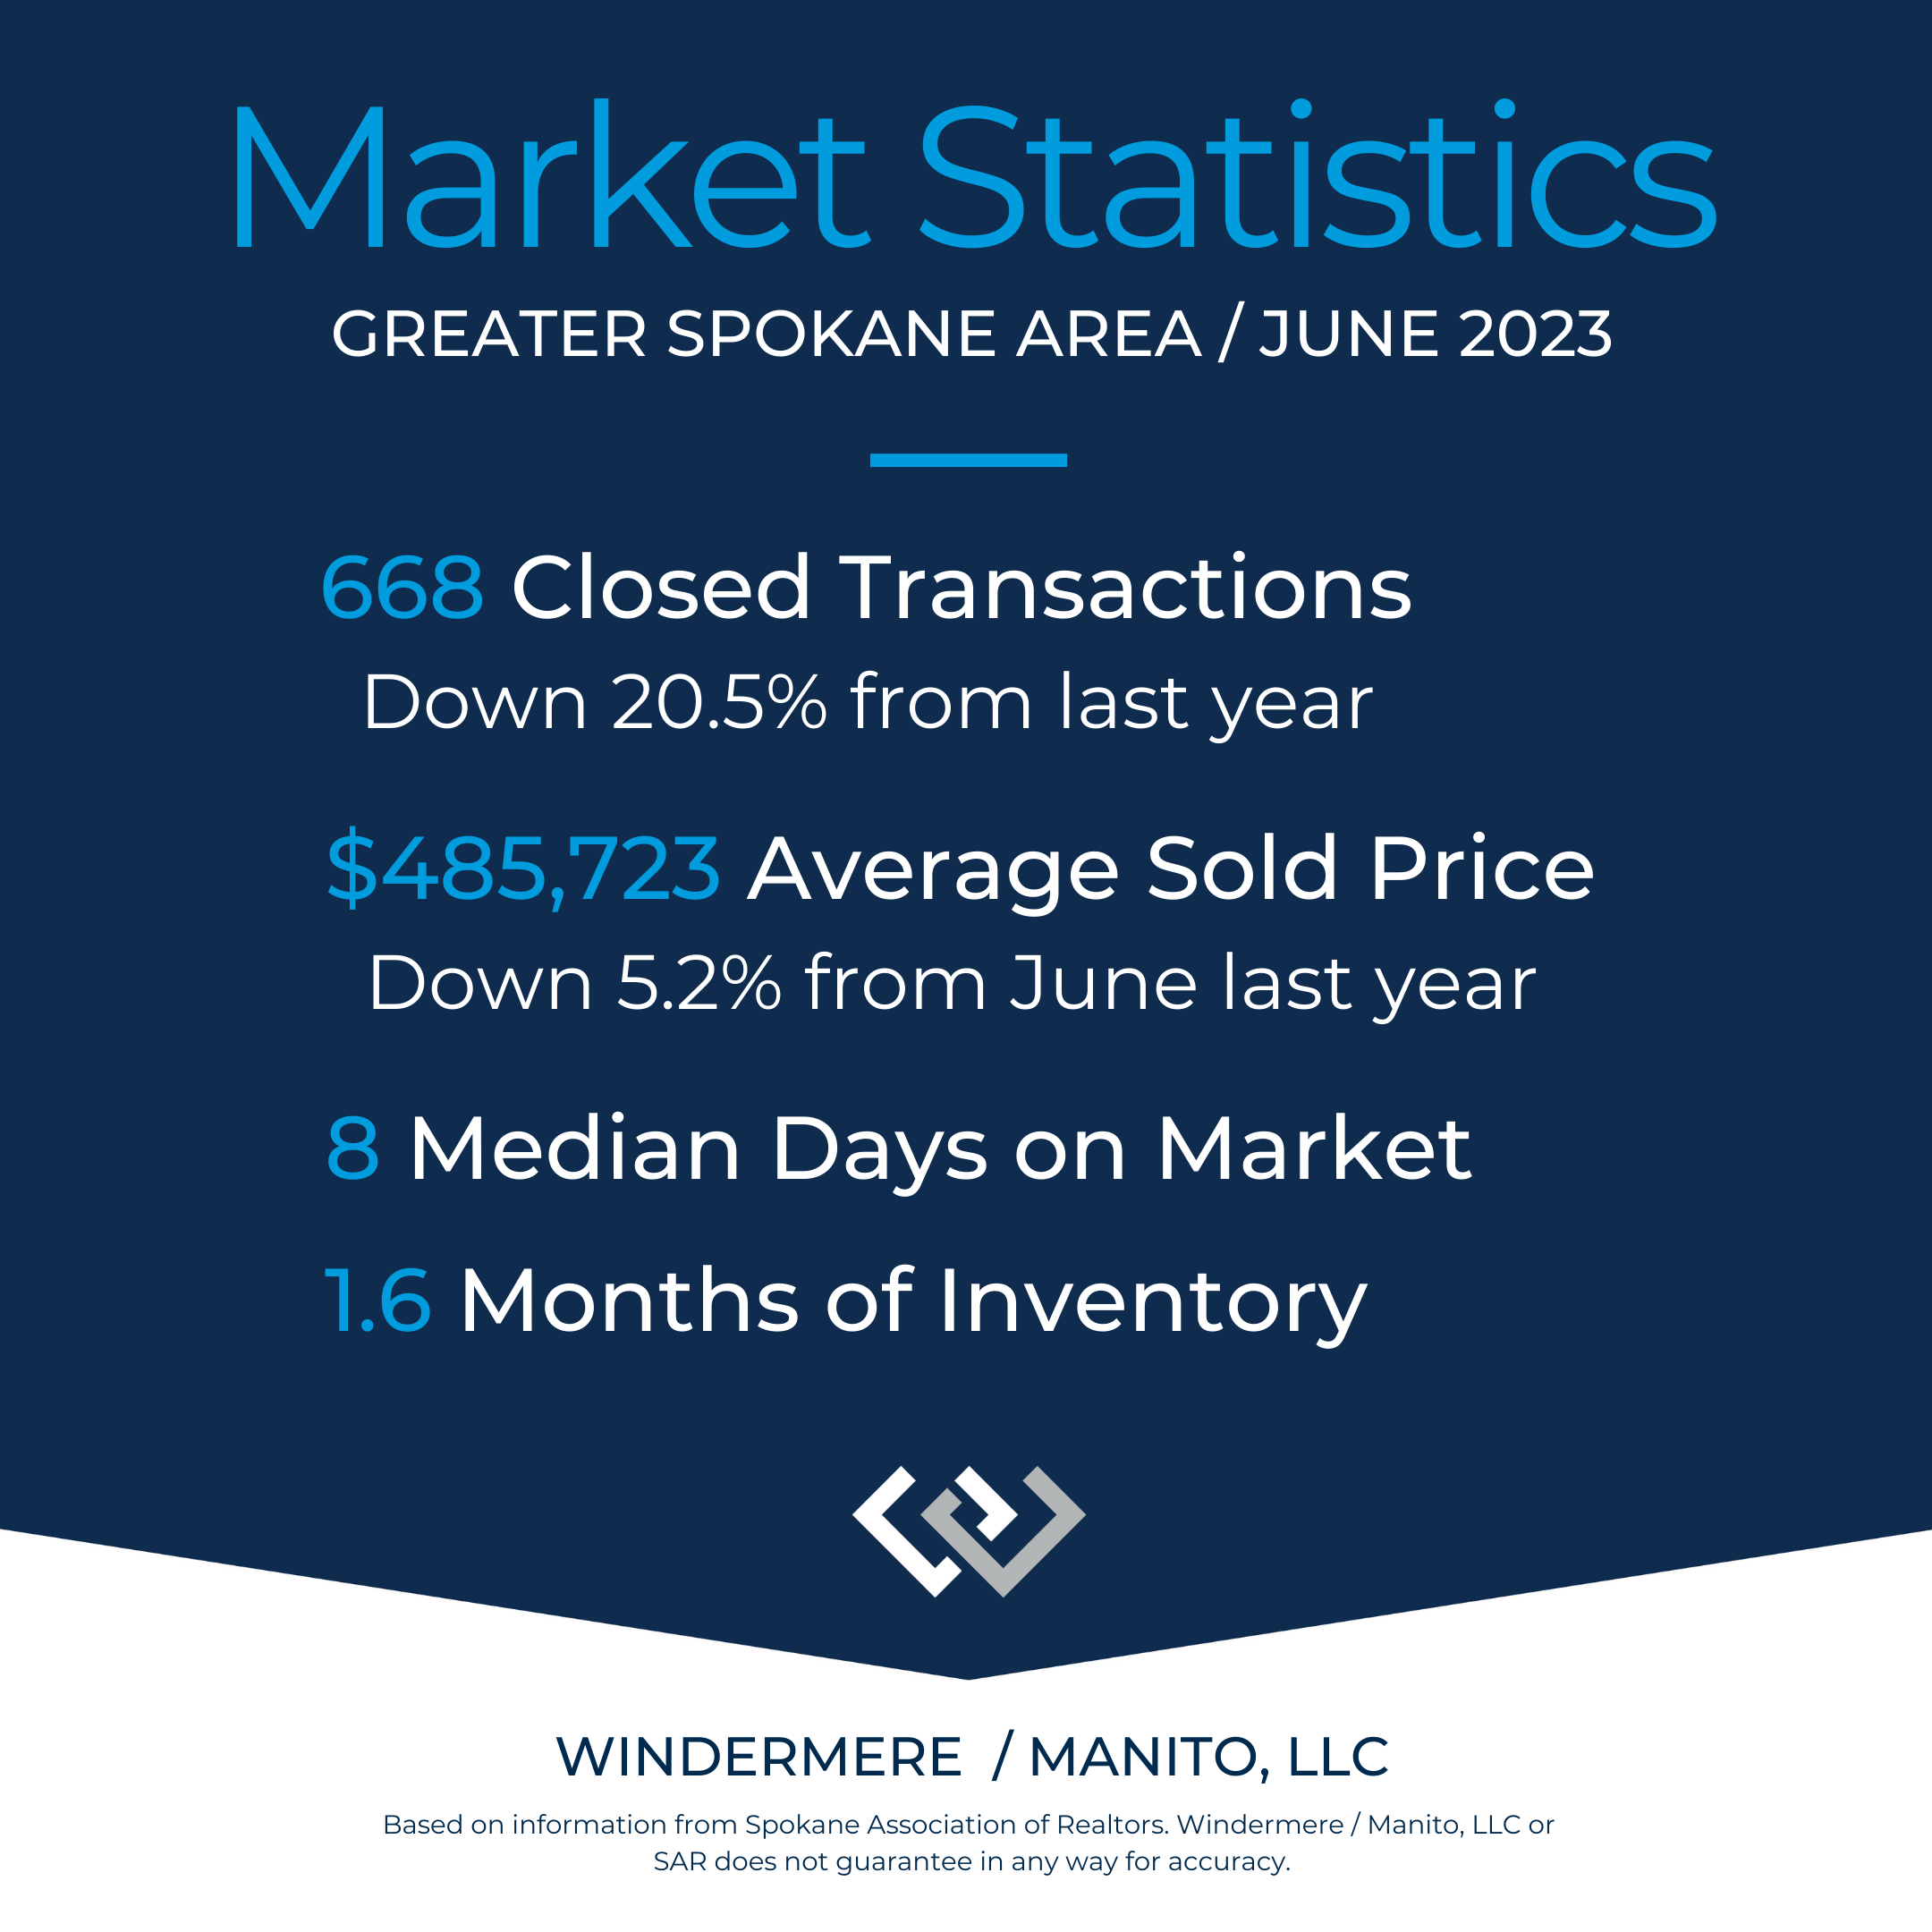
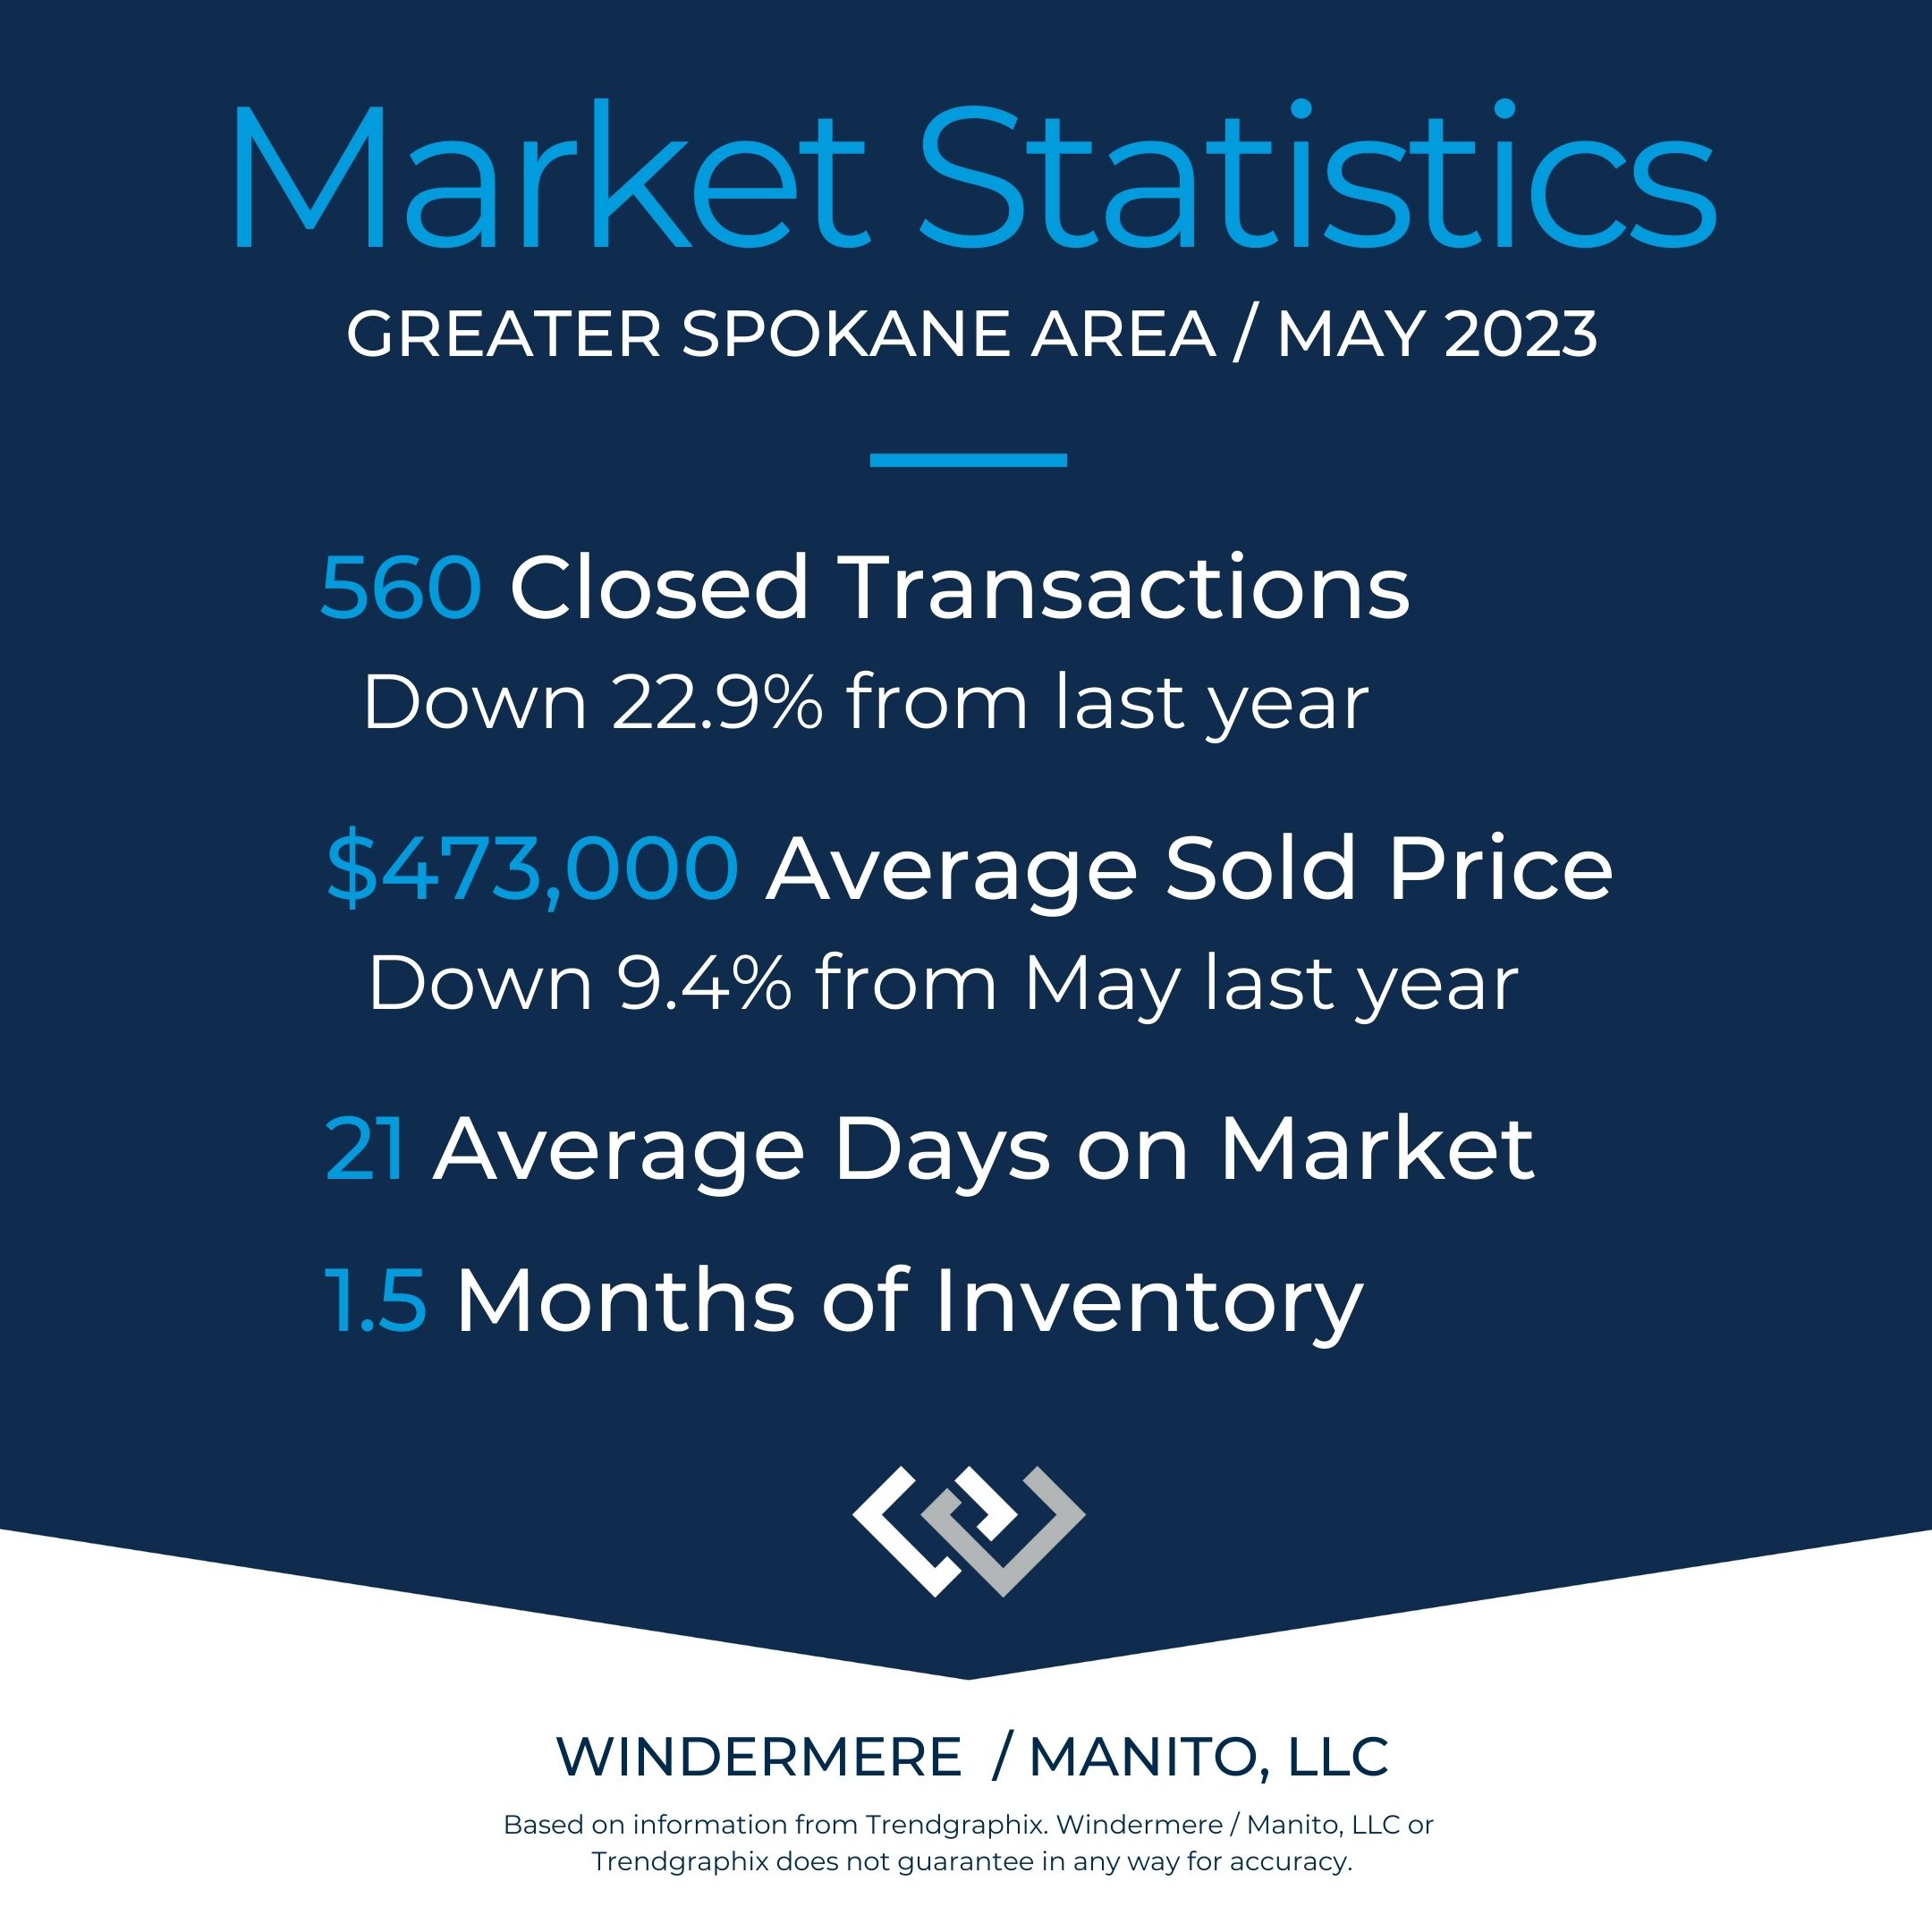
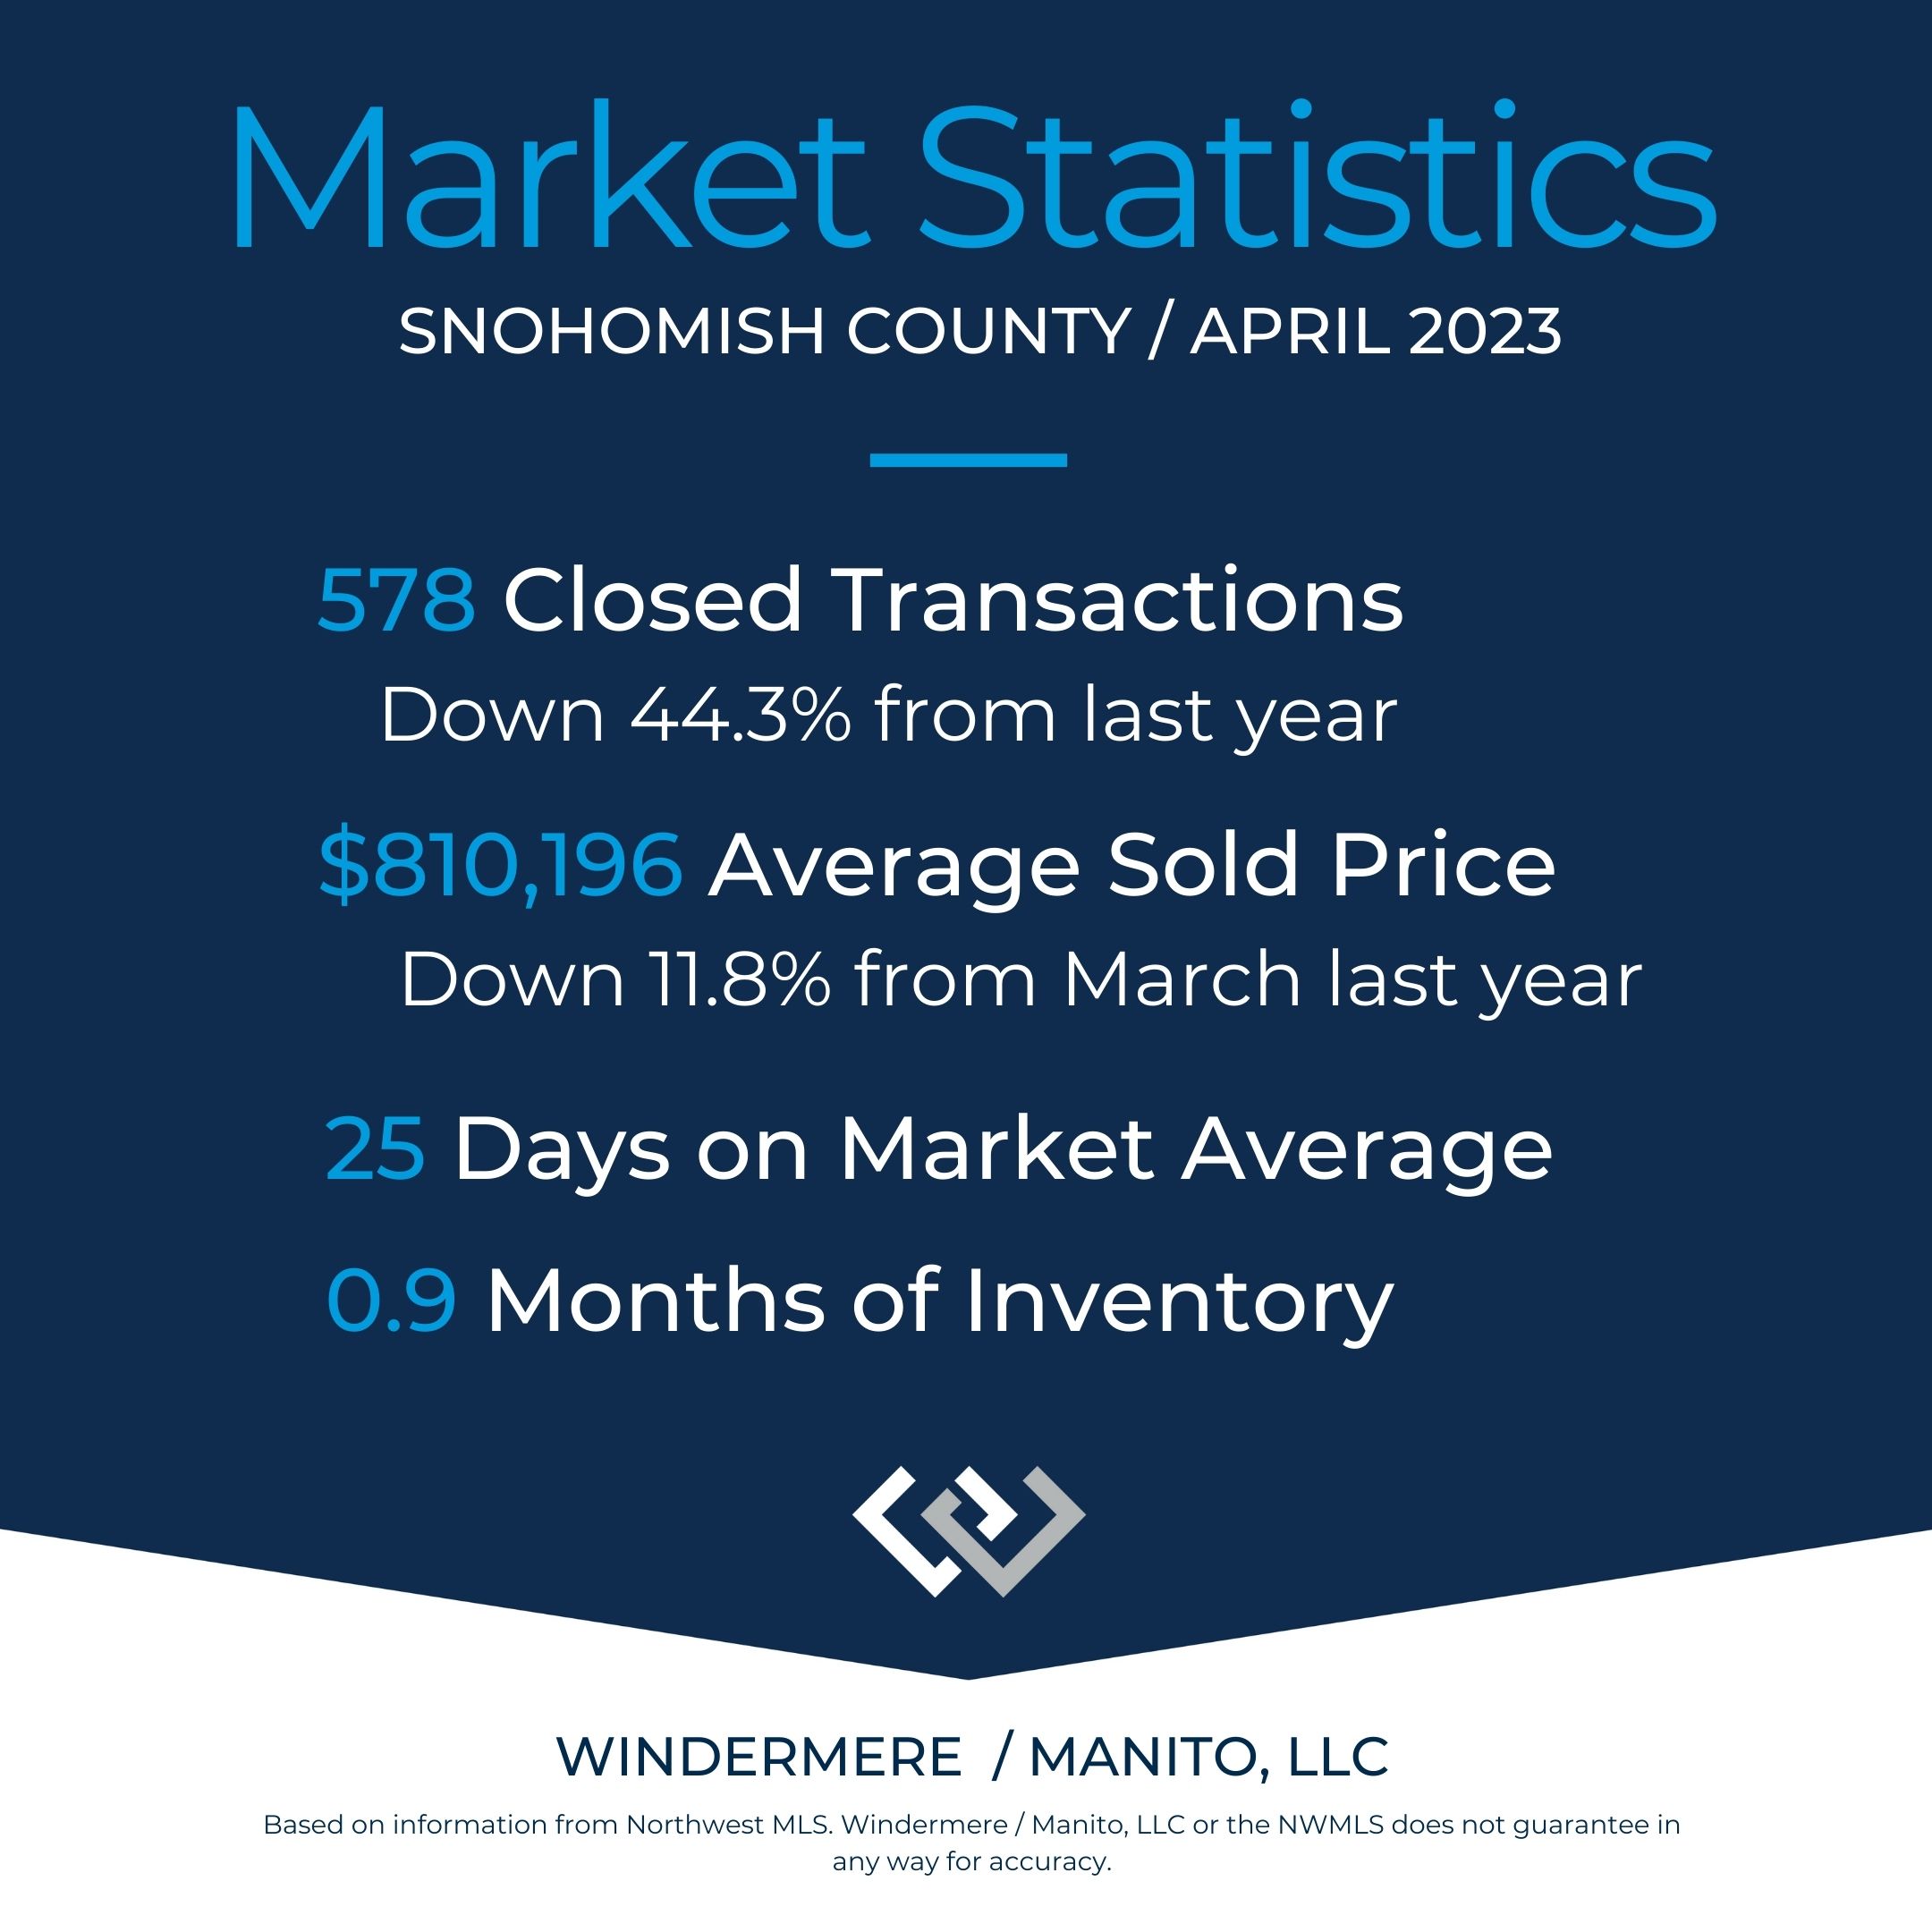
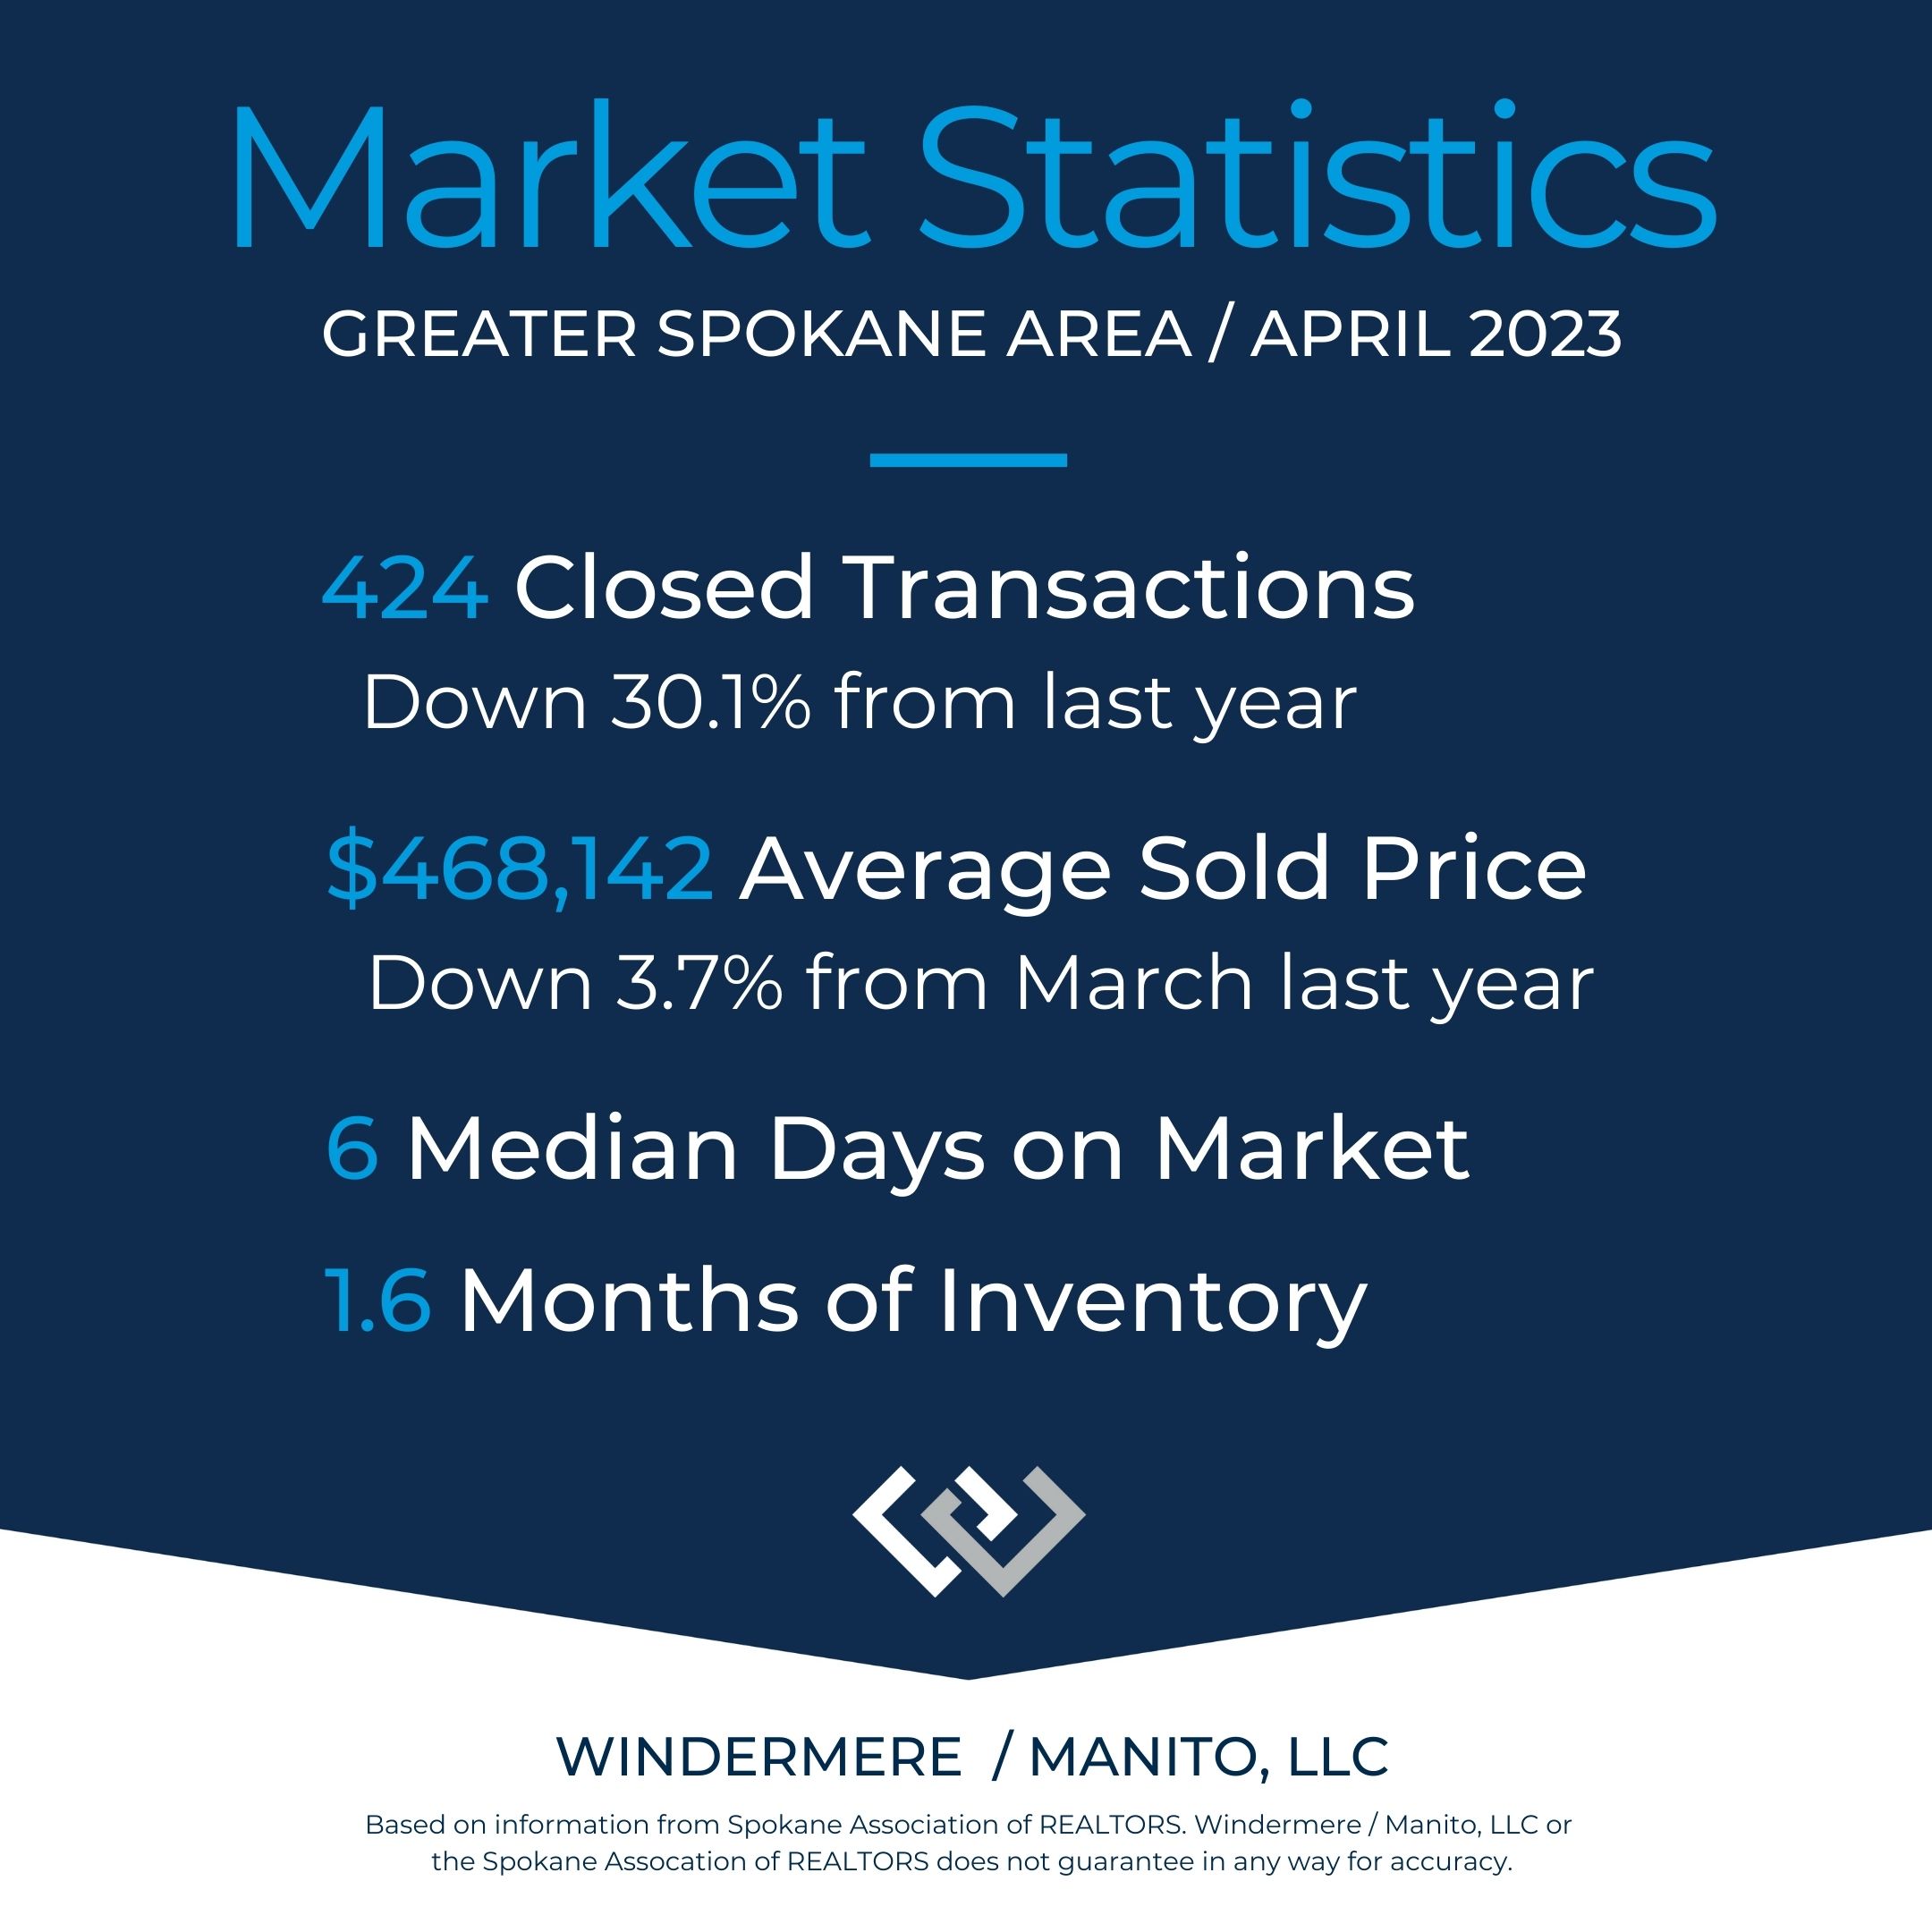
In the Spokane market, we are down year-over-year in number of closed transactions and sold prices.
Yet it is notable, during Q1 of 2023, we saw new listings down 2.4% (not shown on this chart). The market is slower, but we are not suffering as much from highly constricted inventory as Snohomish County for example (stats above).
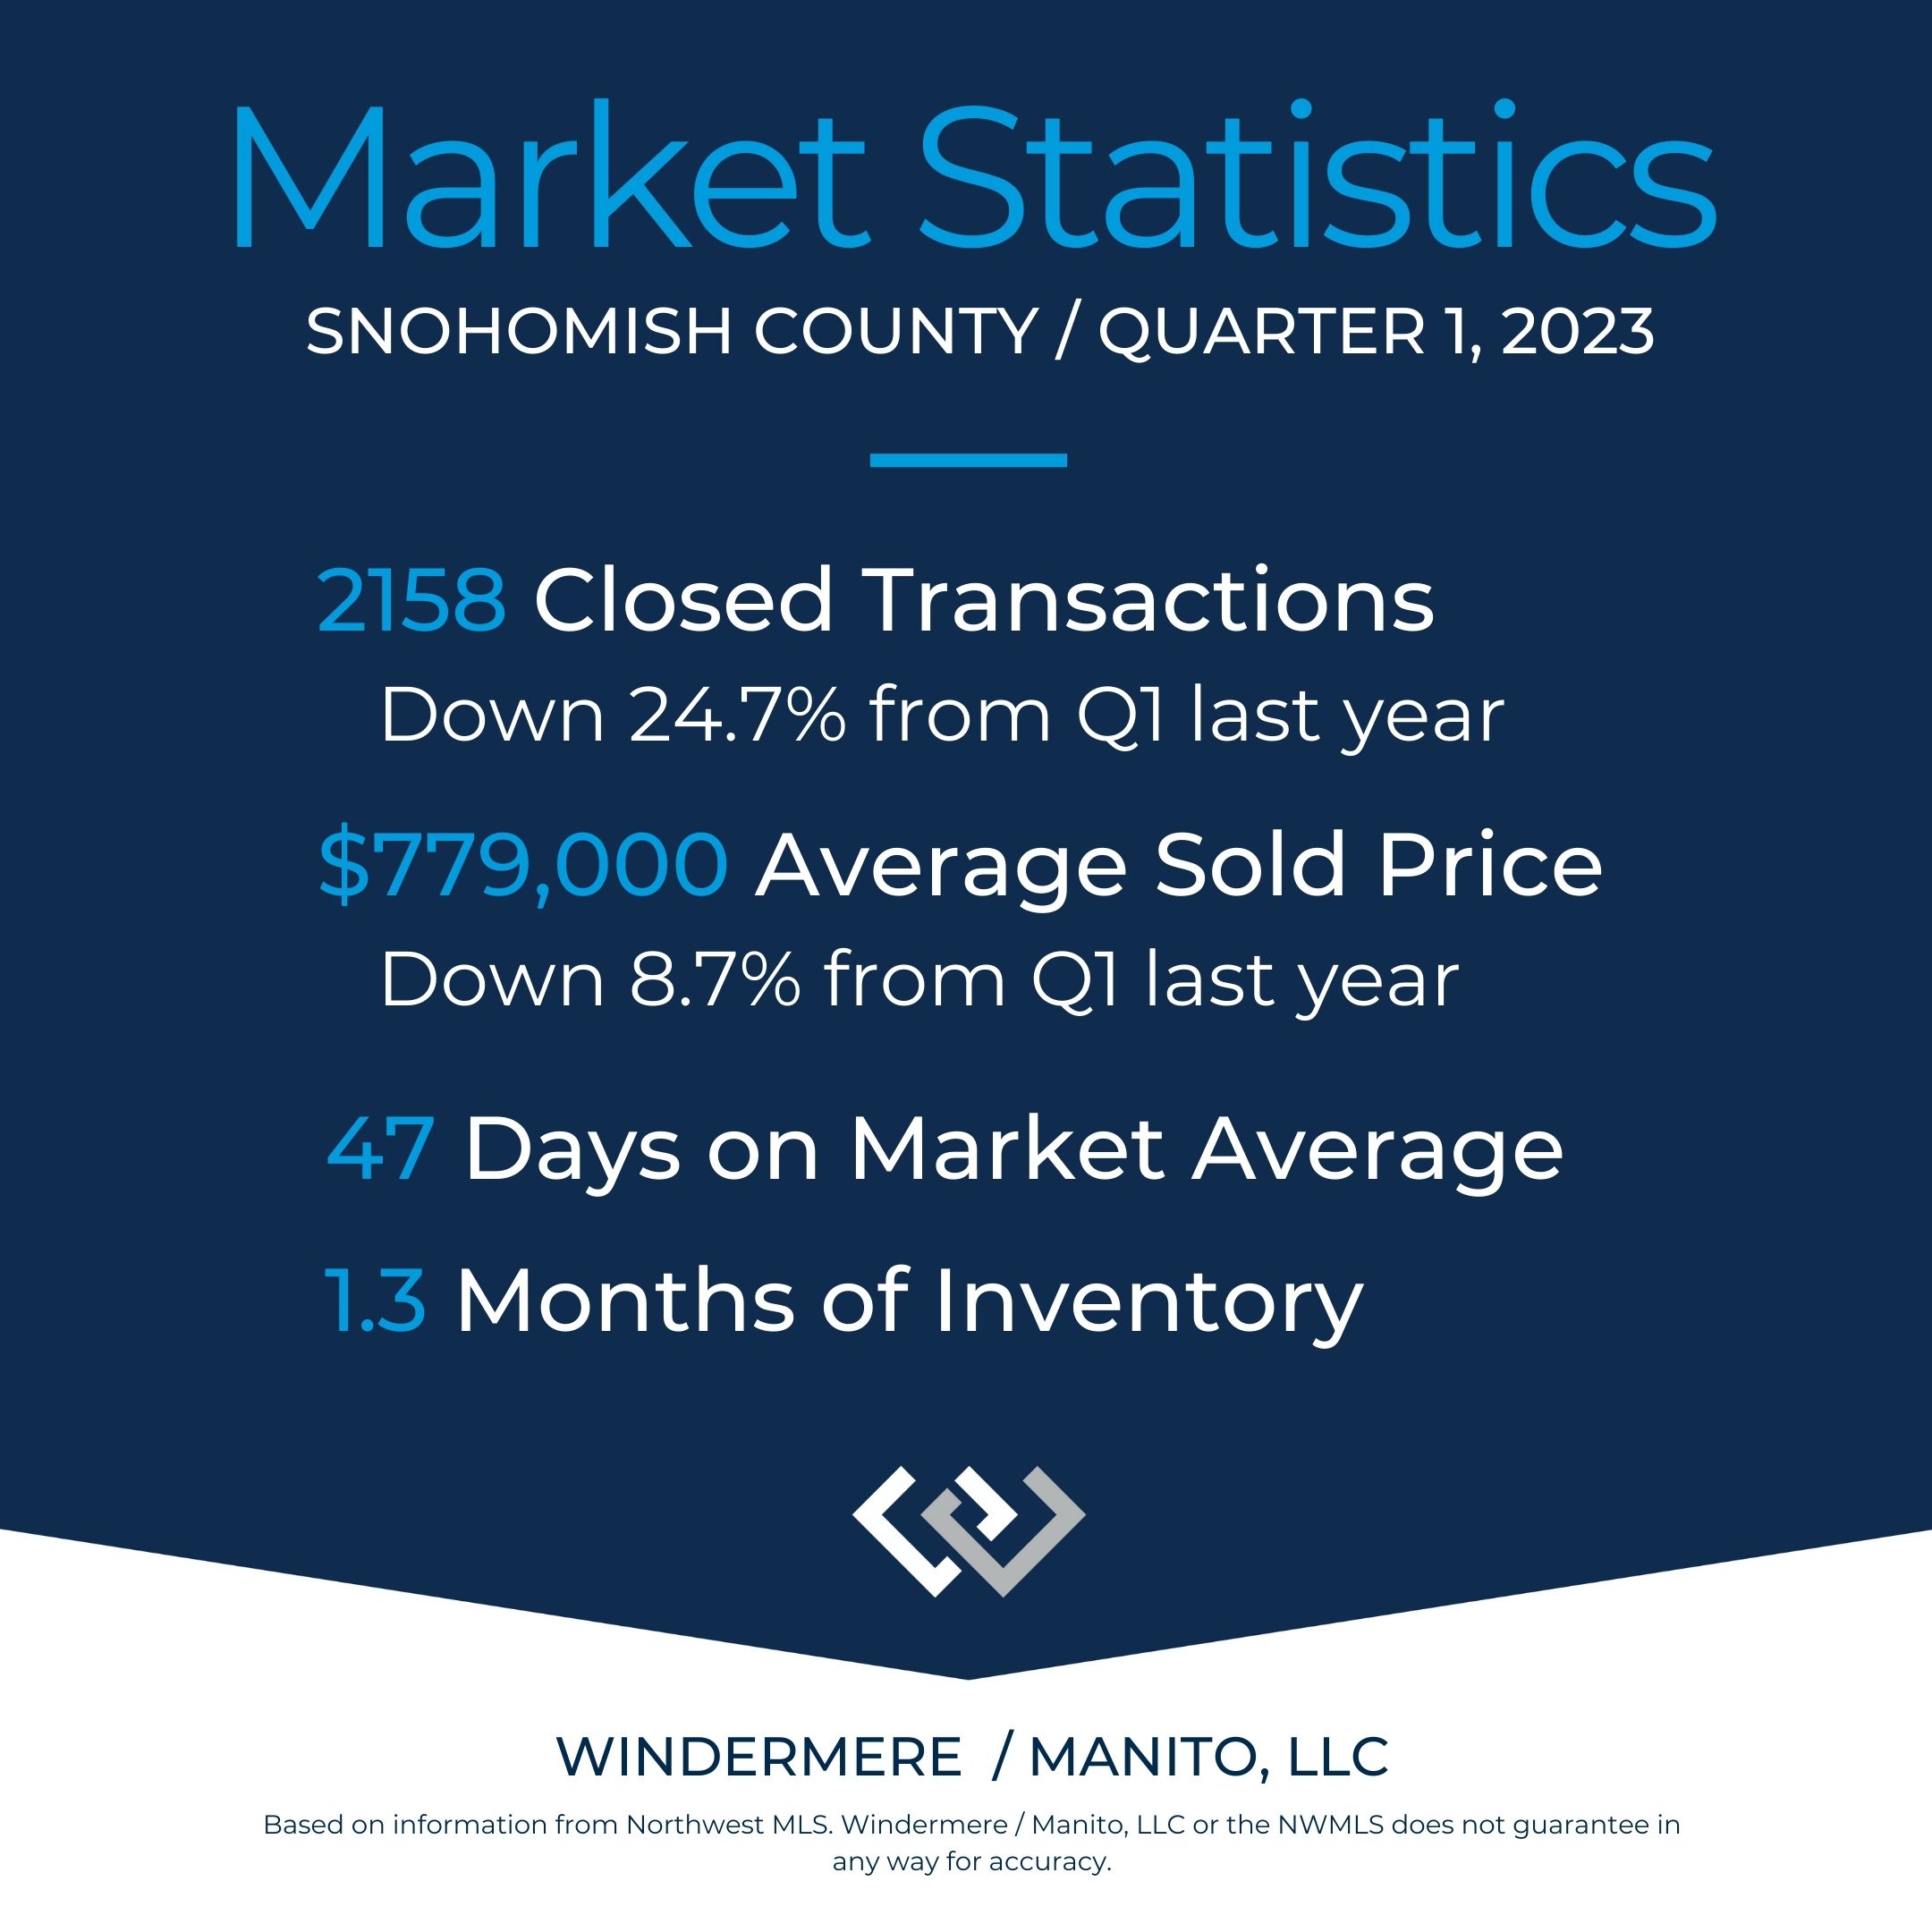
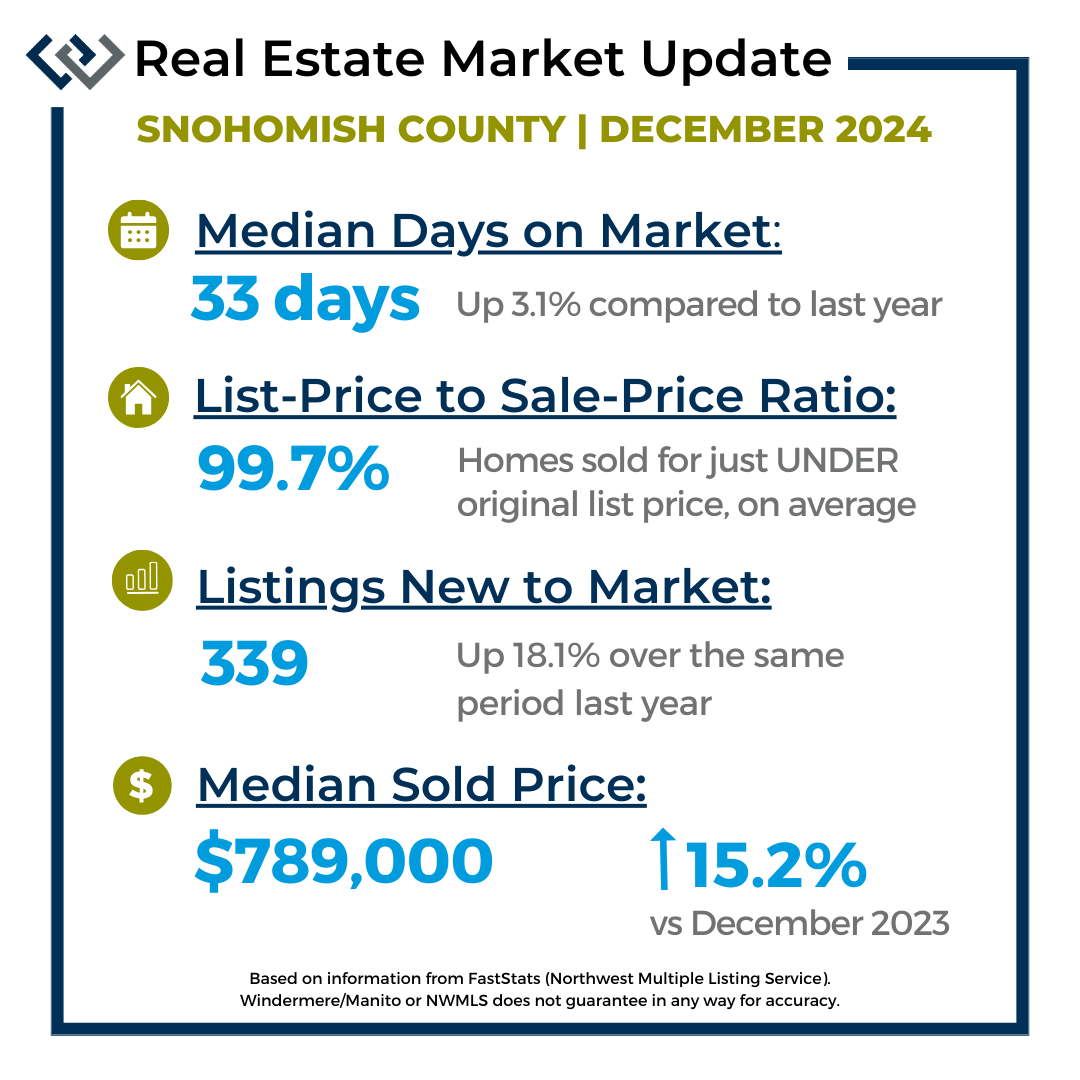
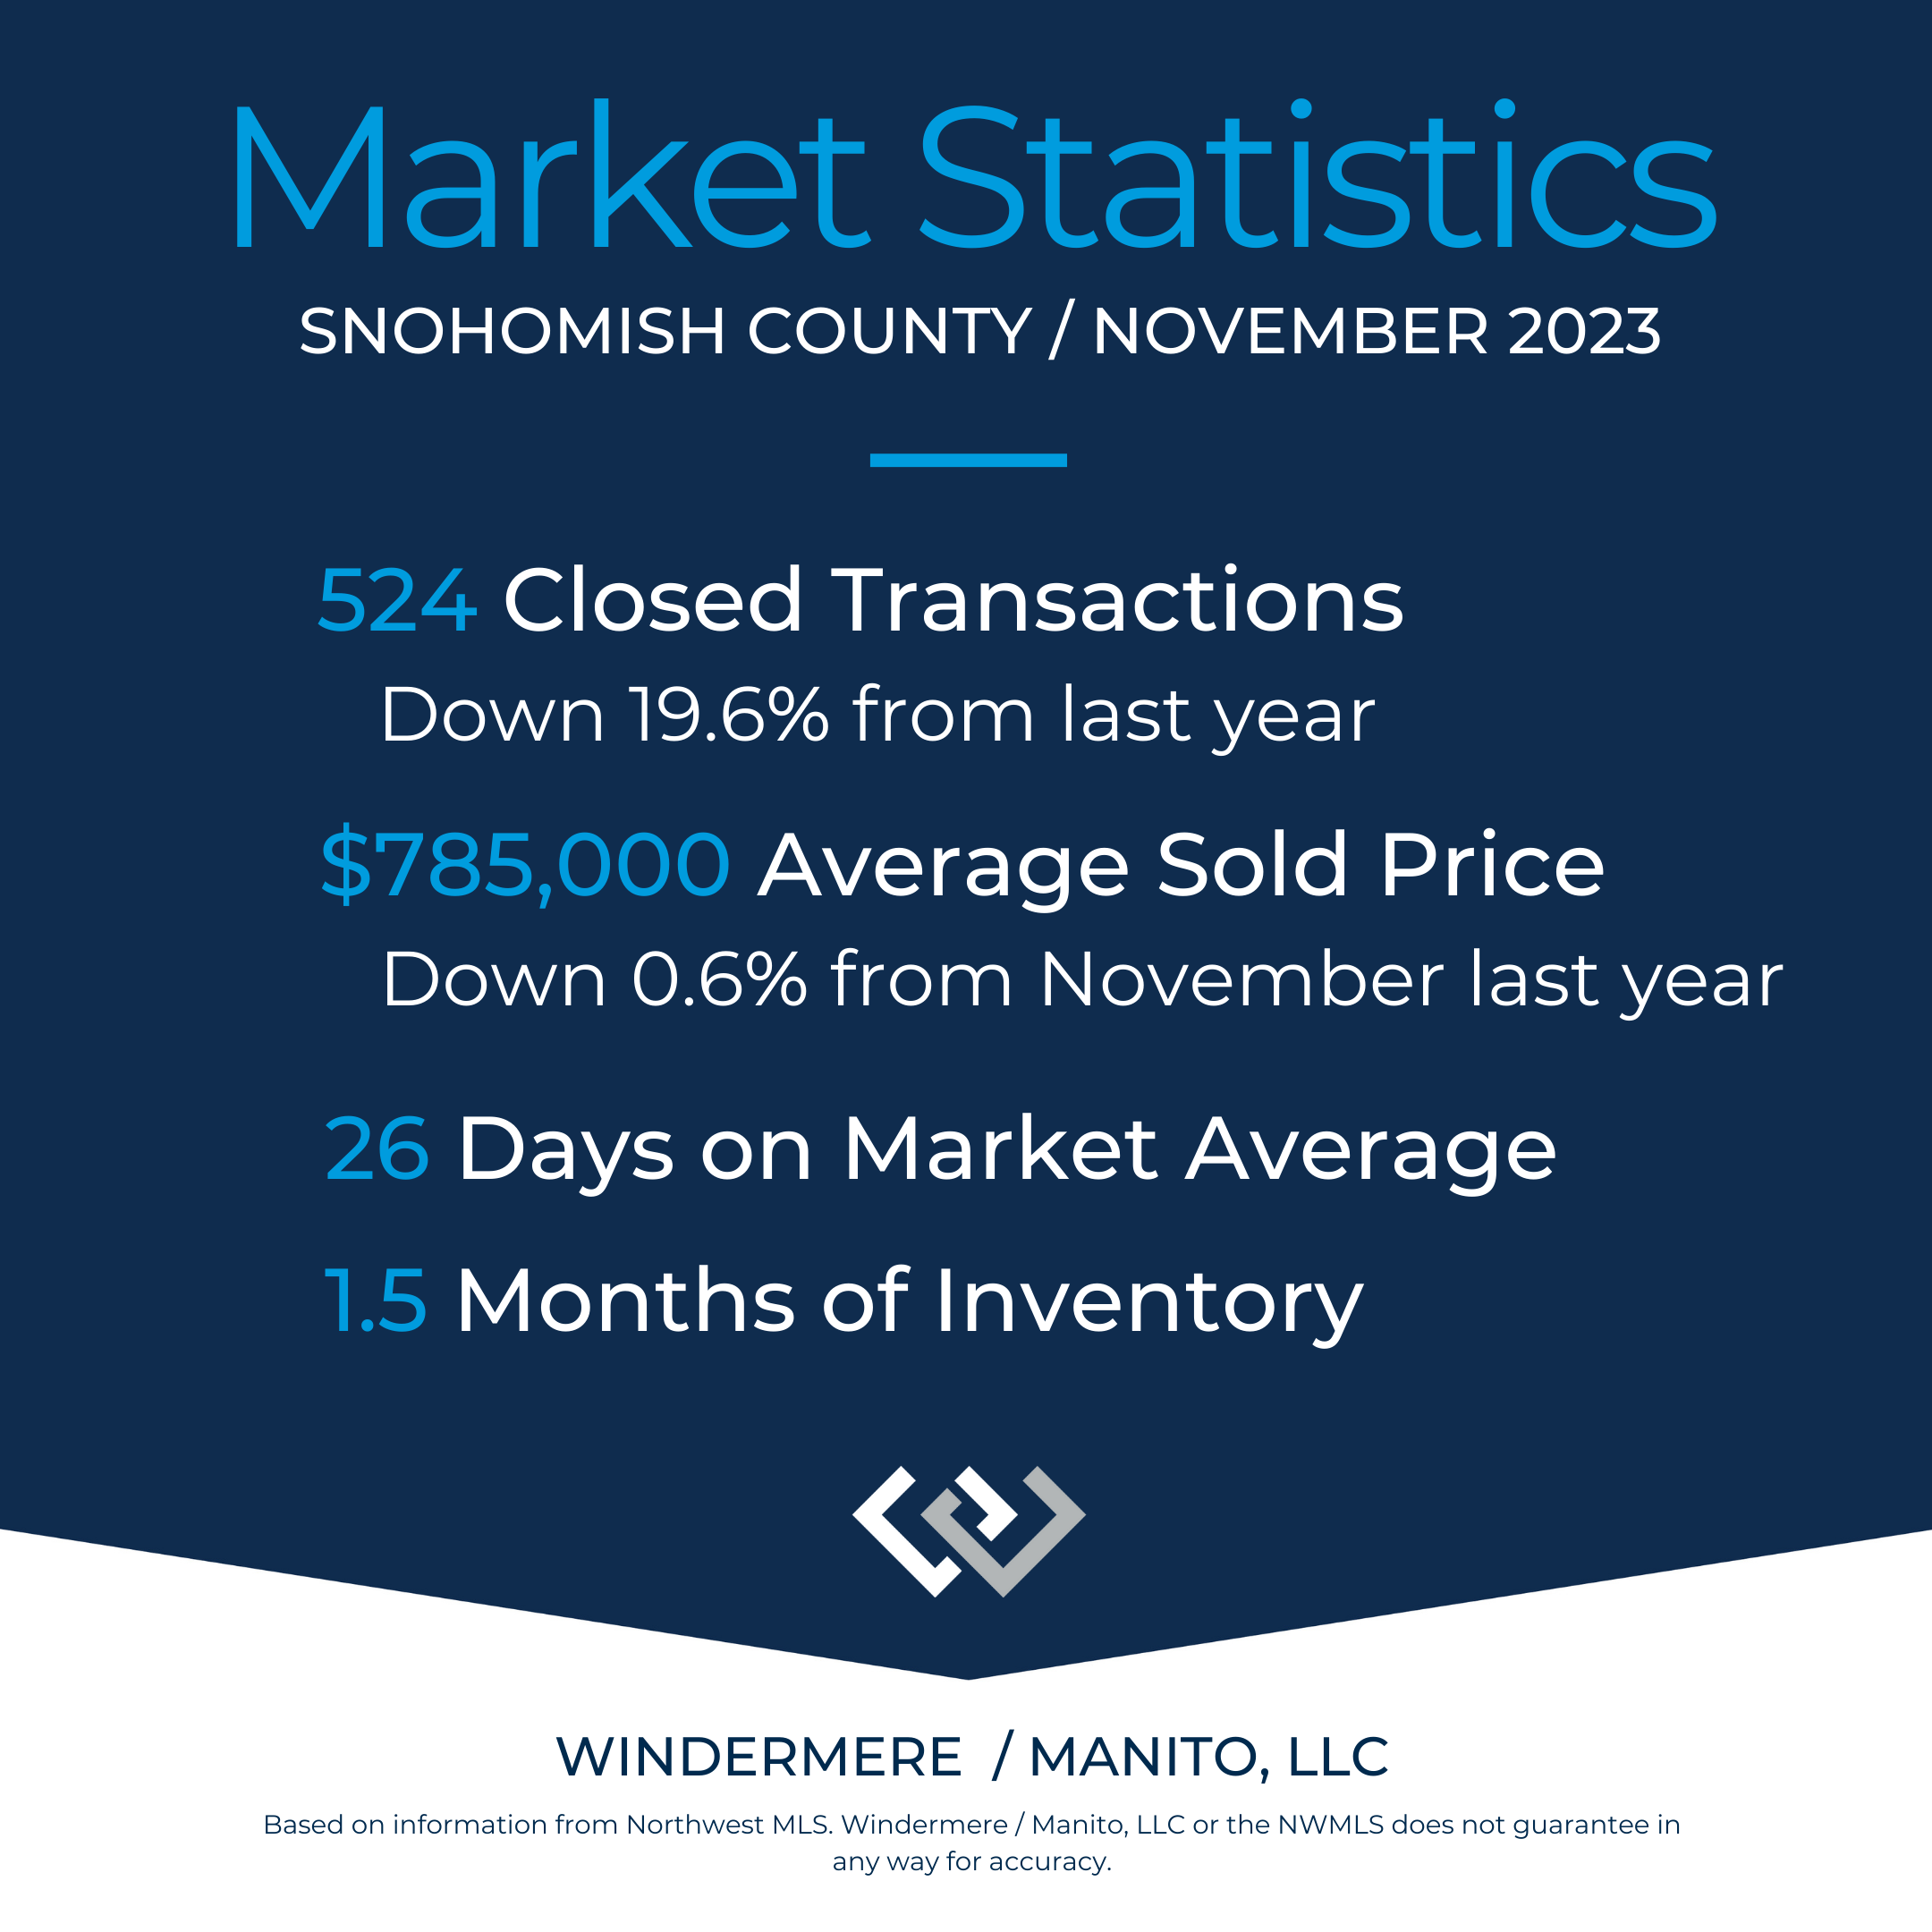
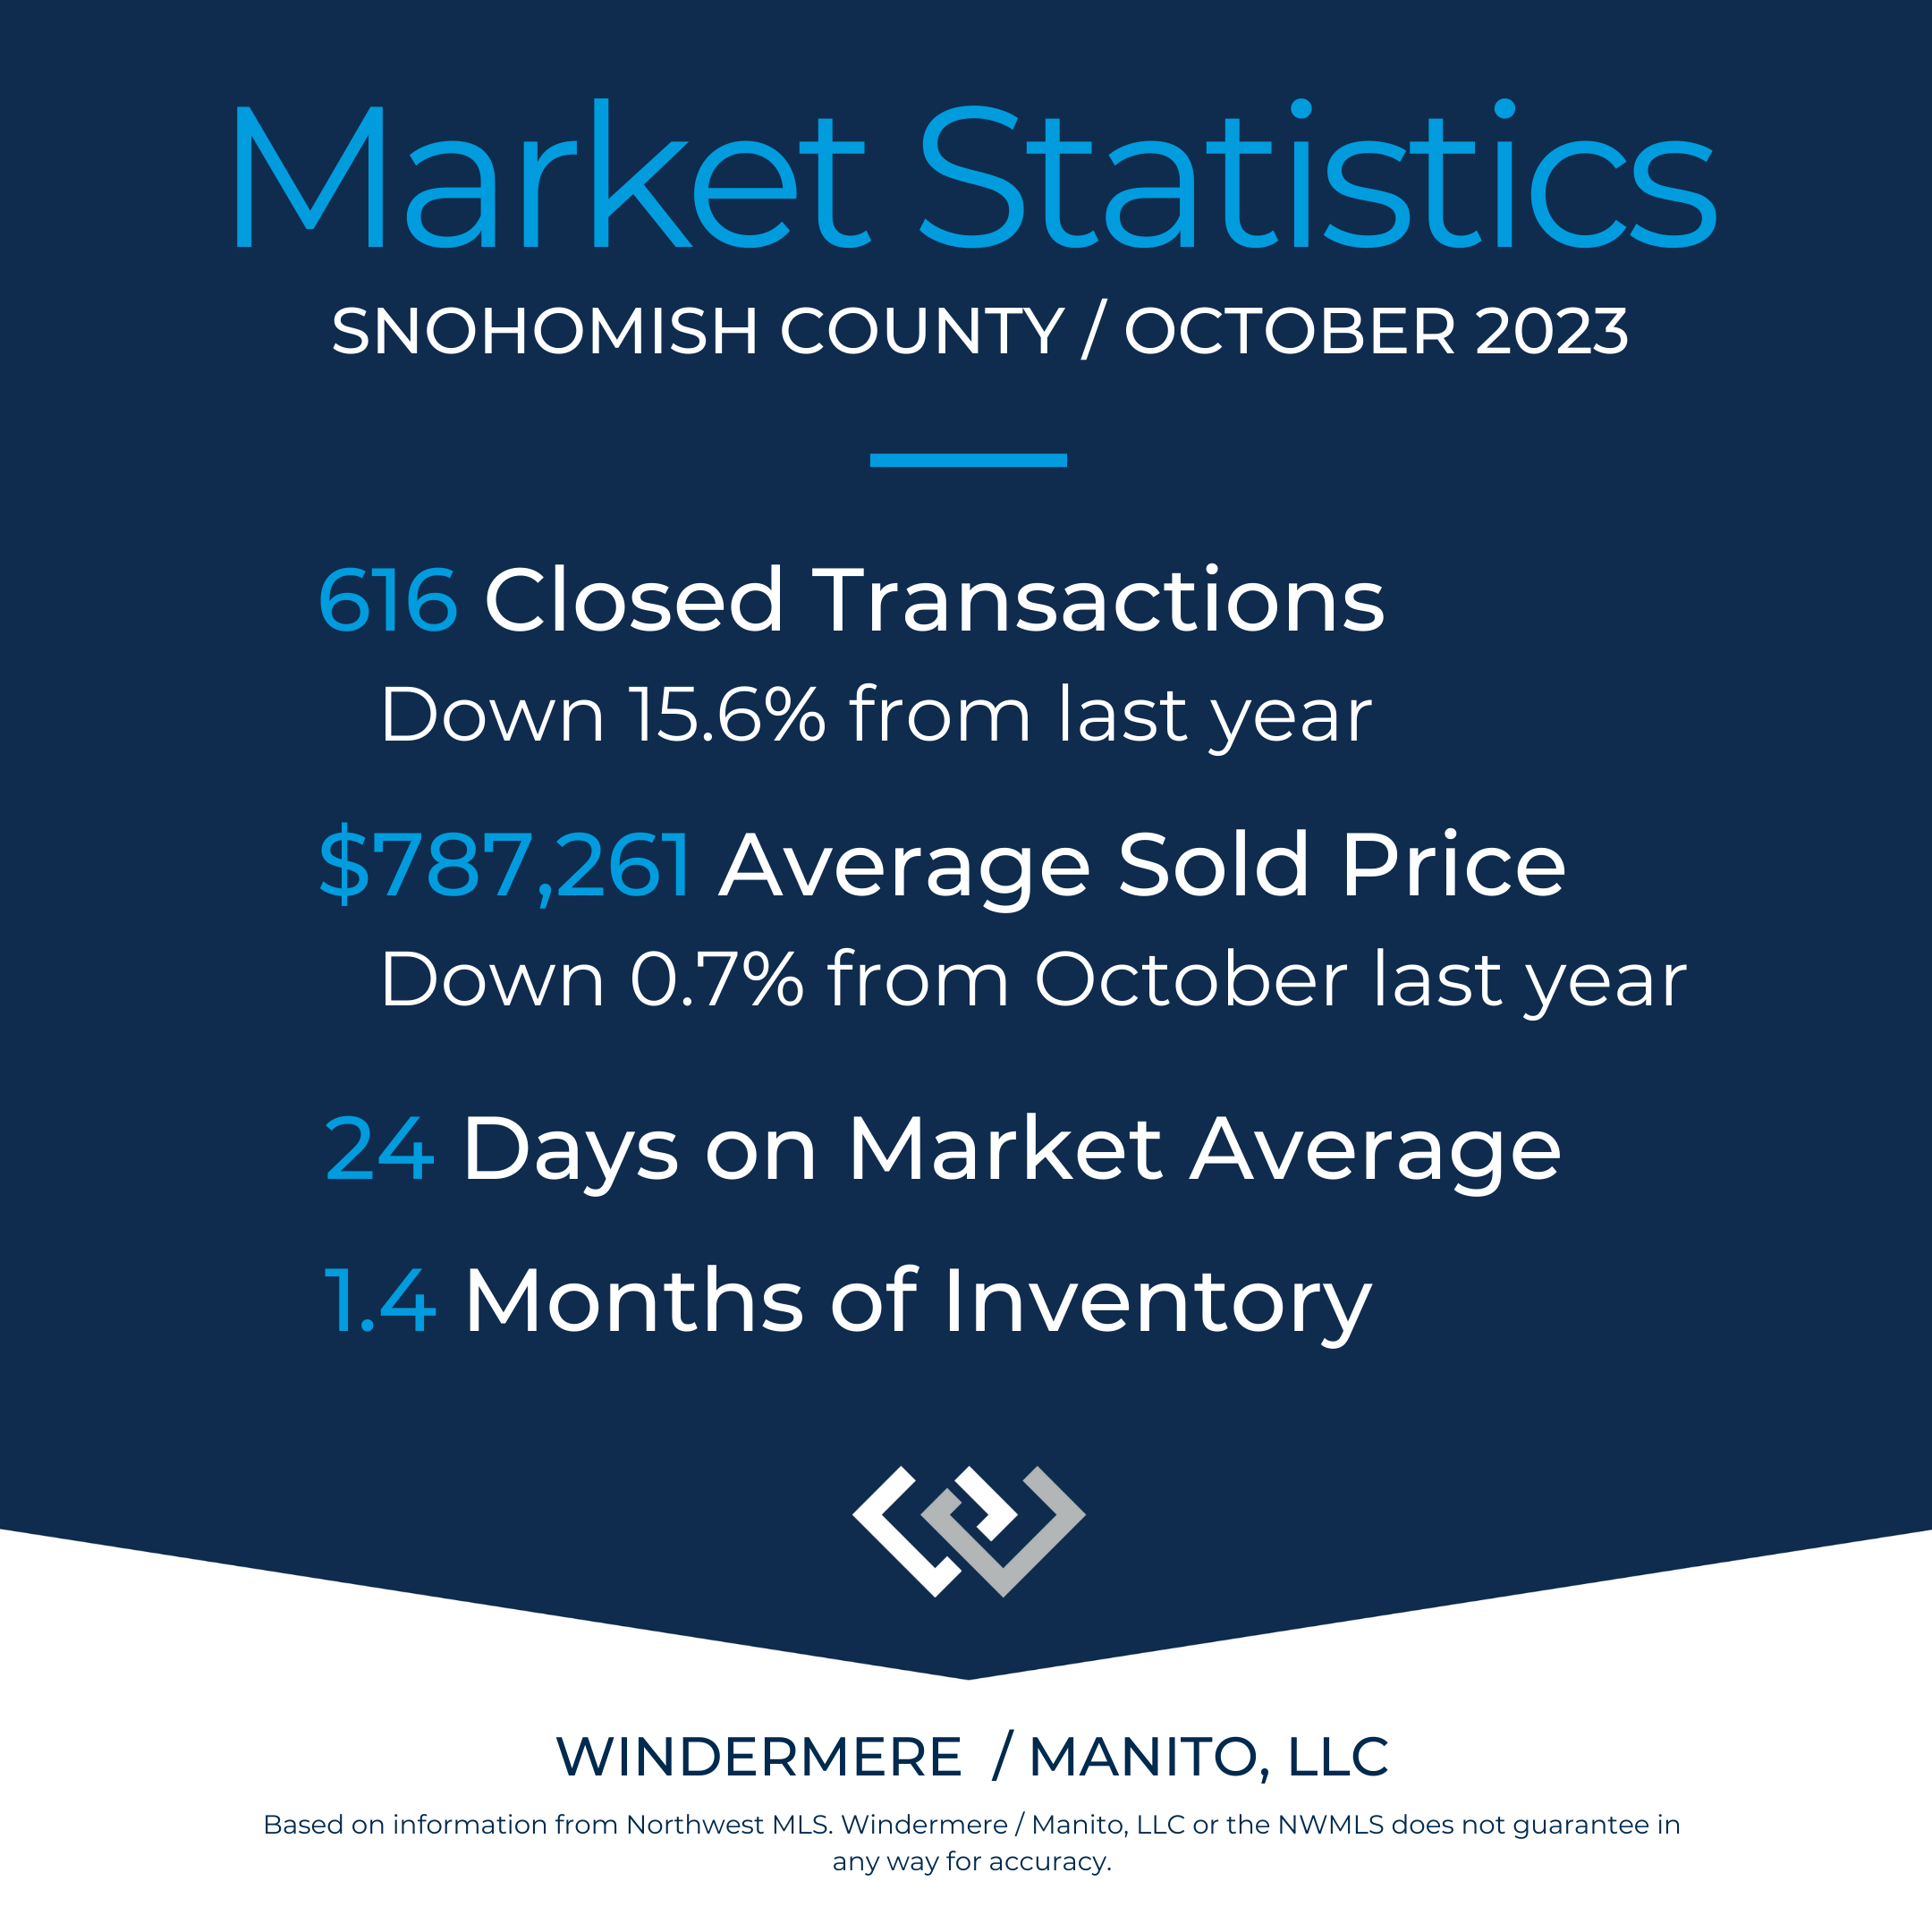
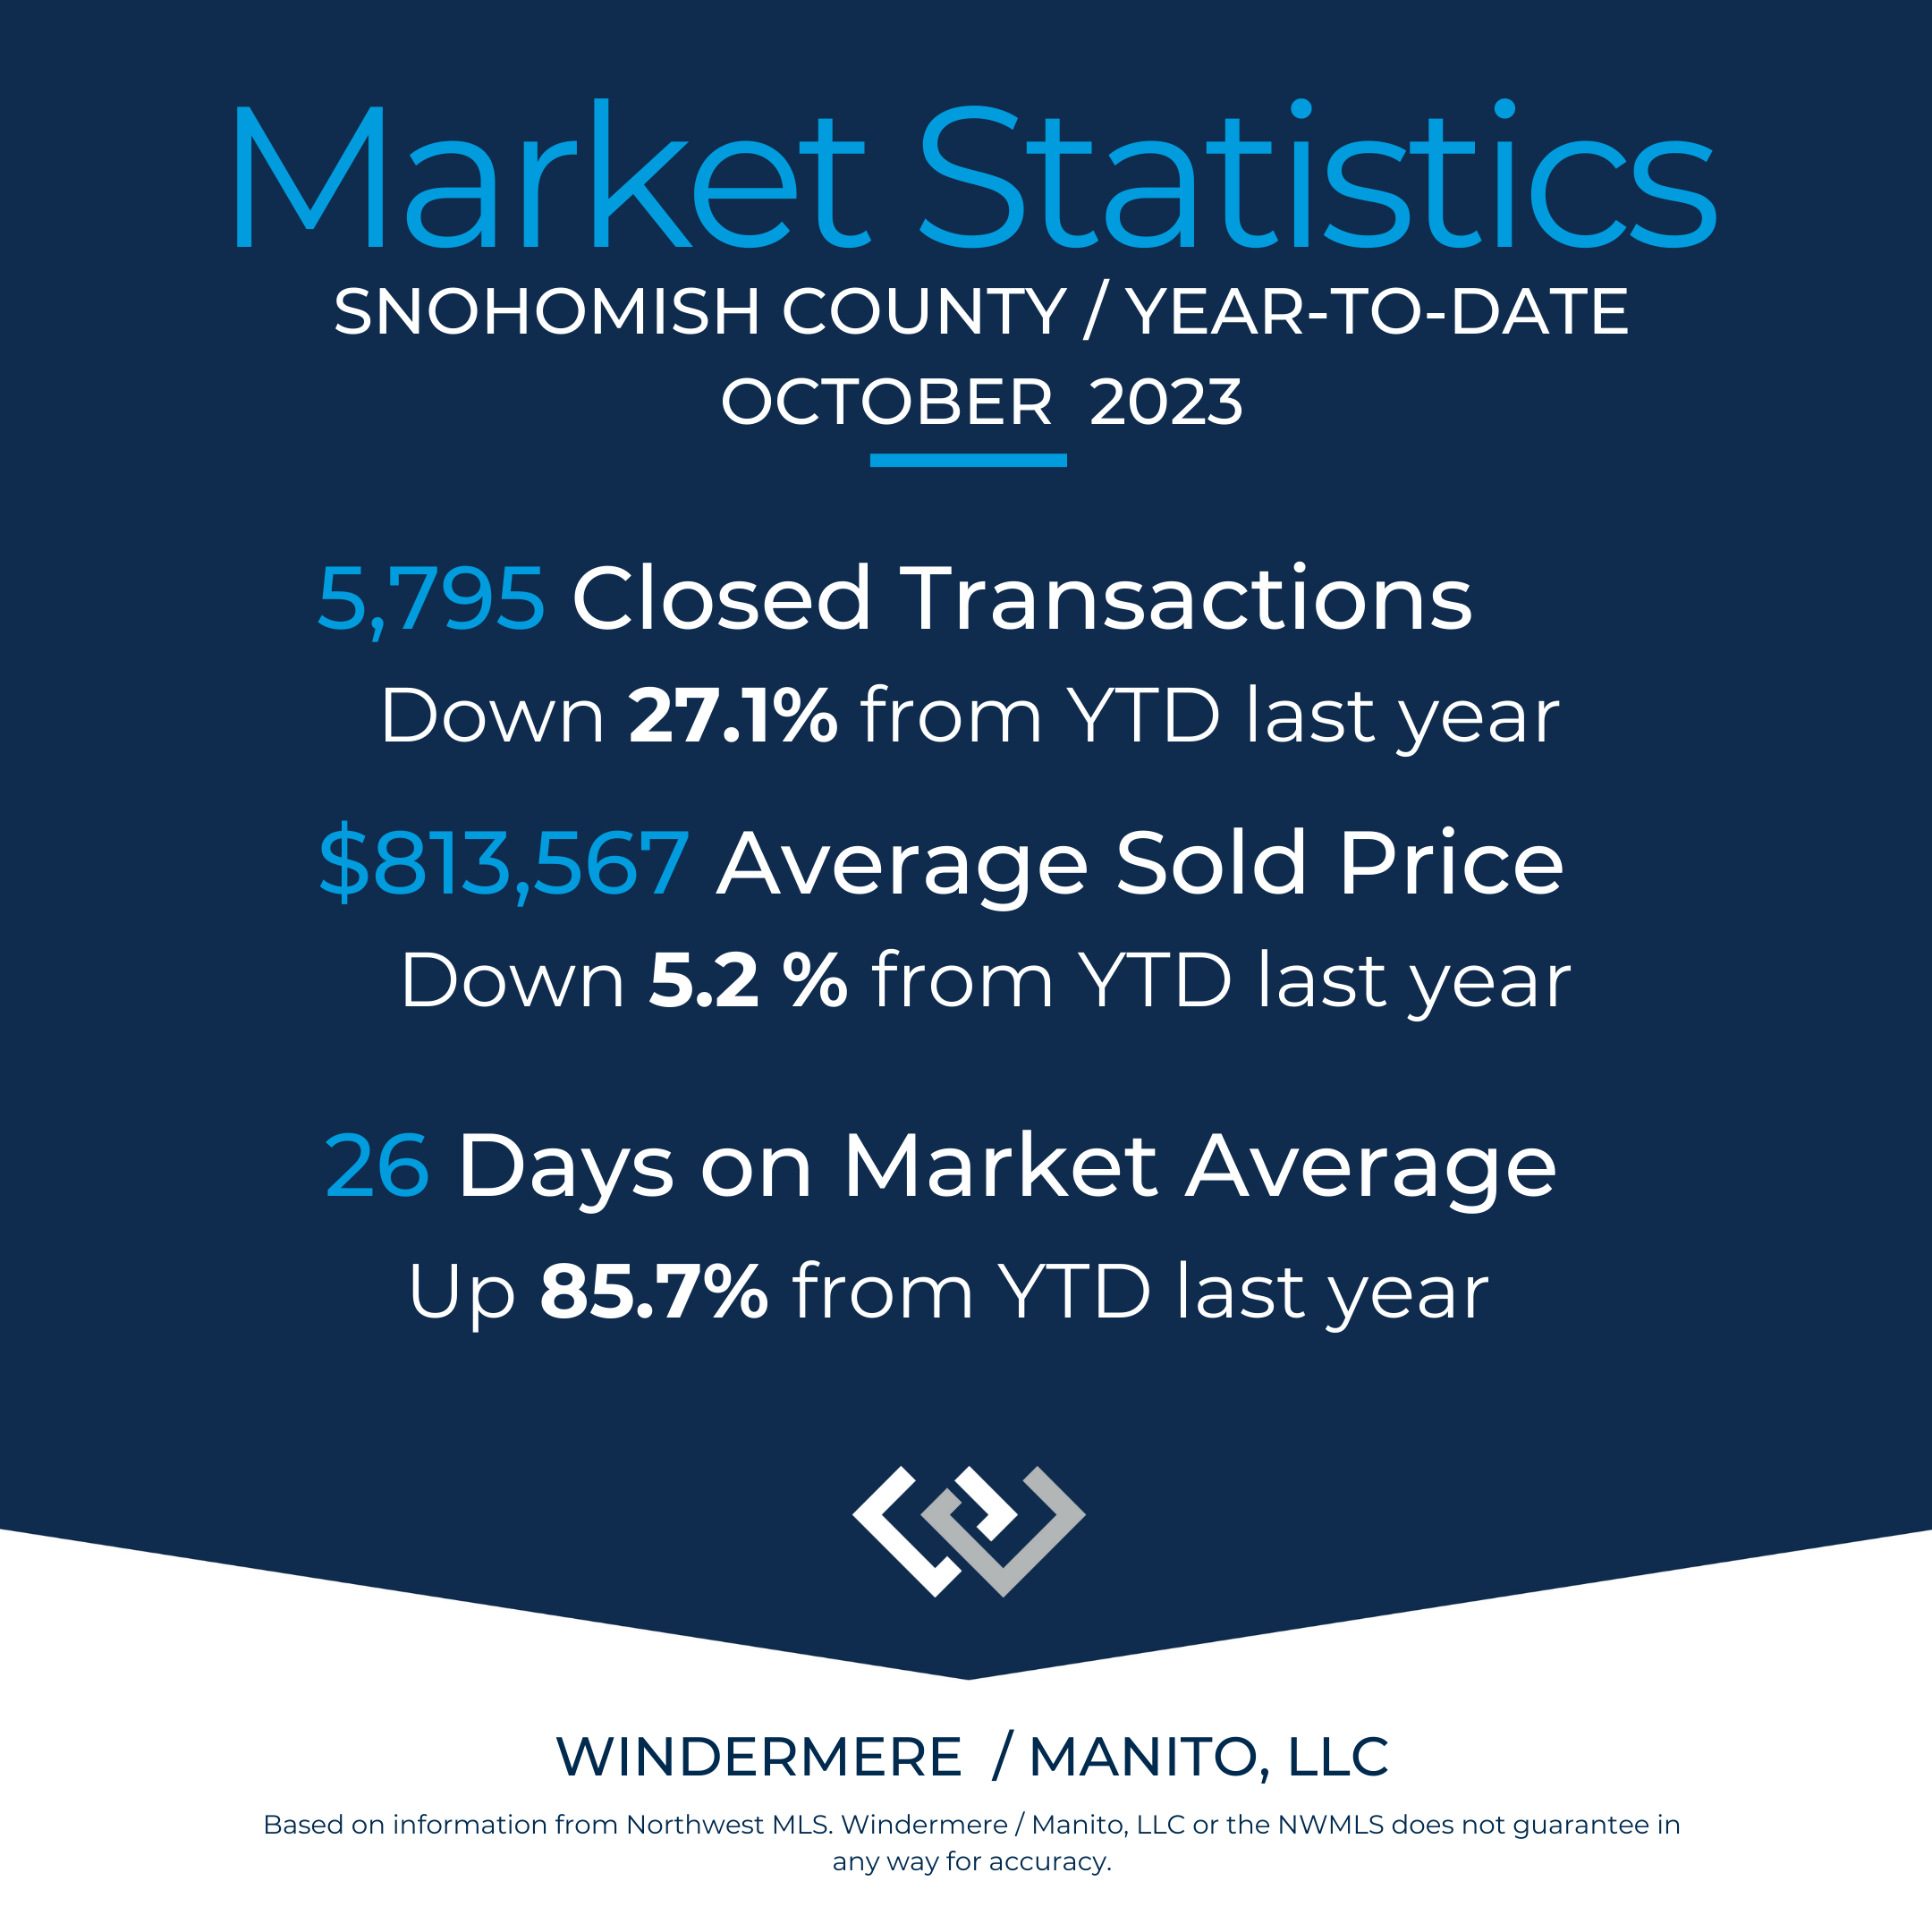
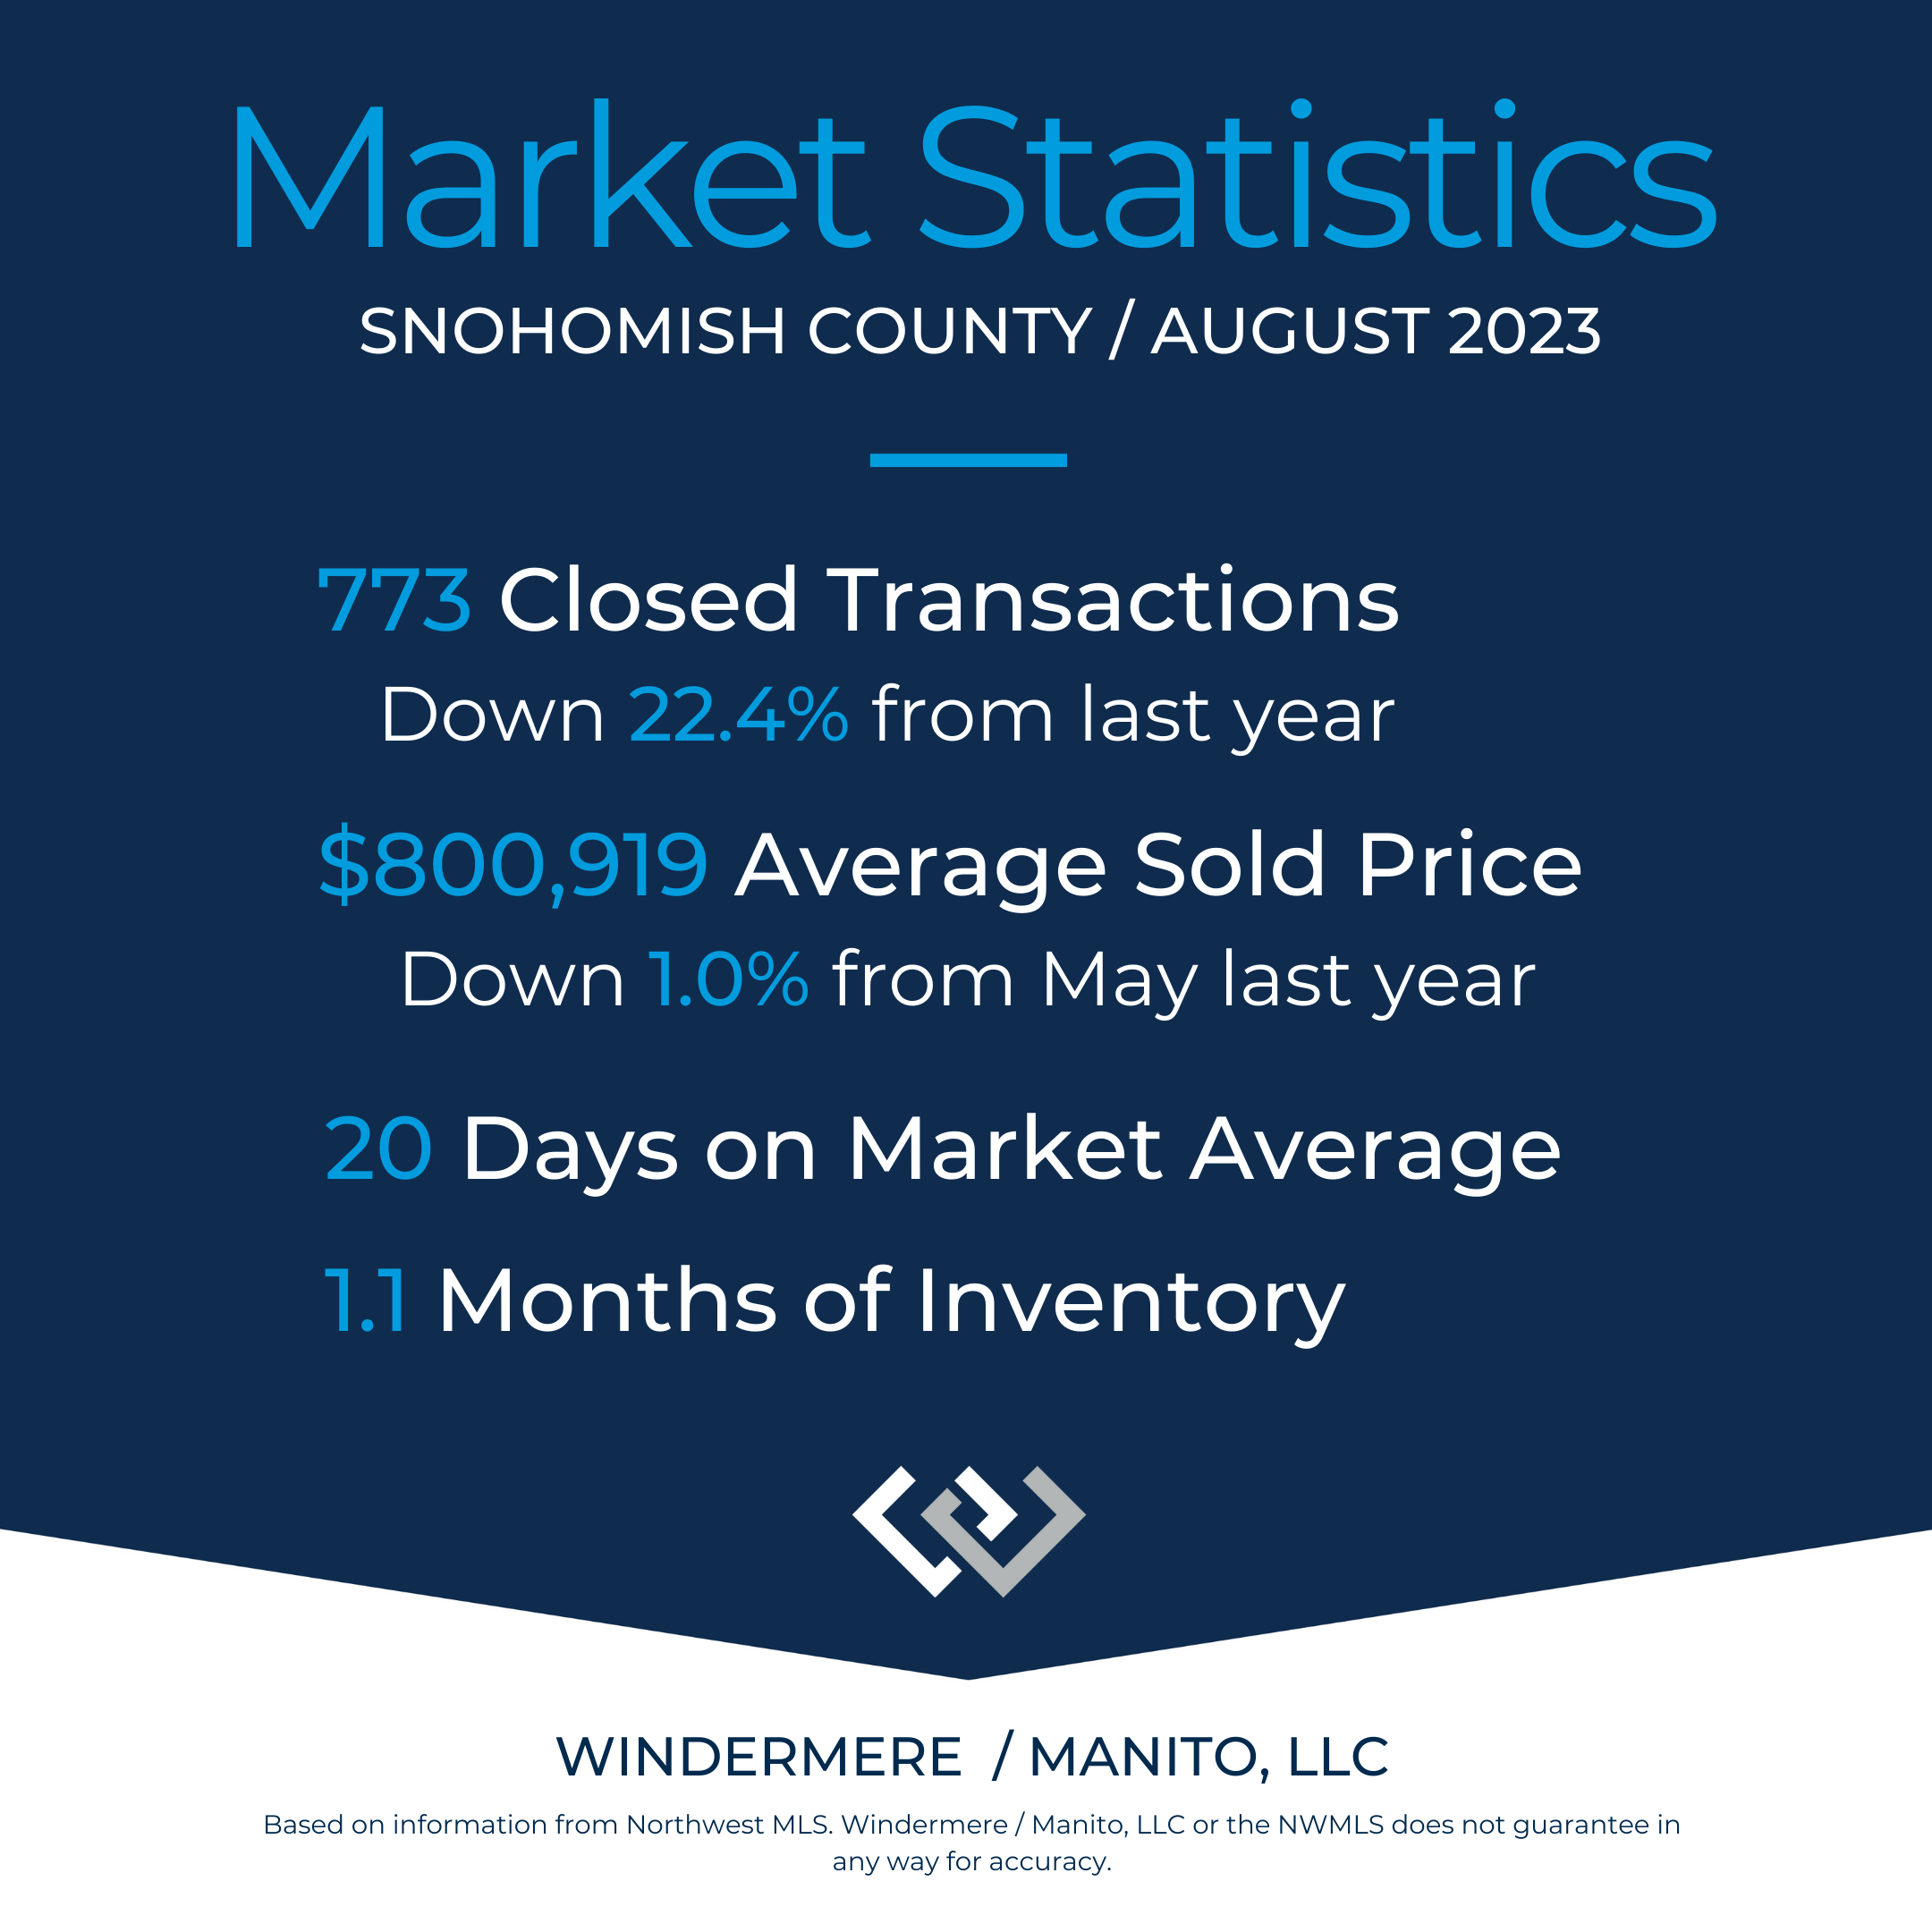
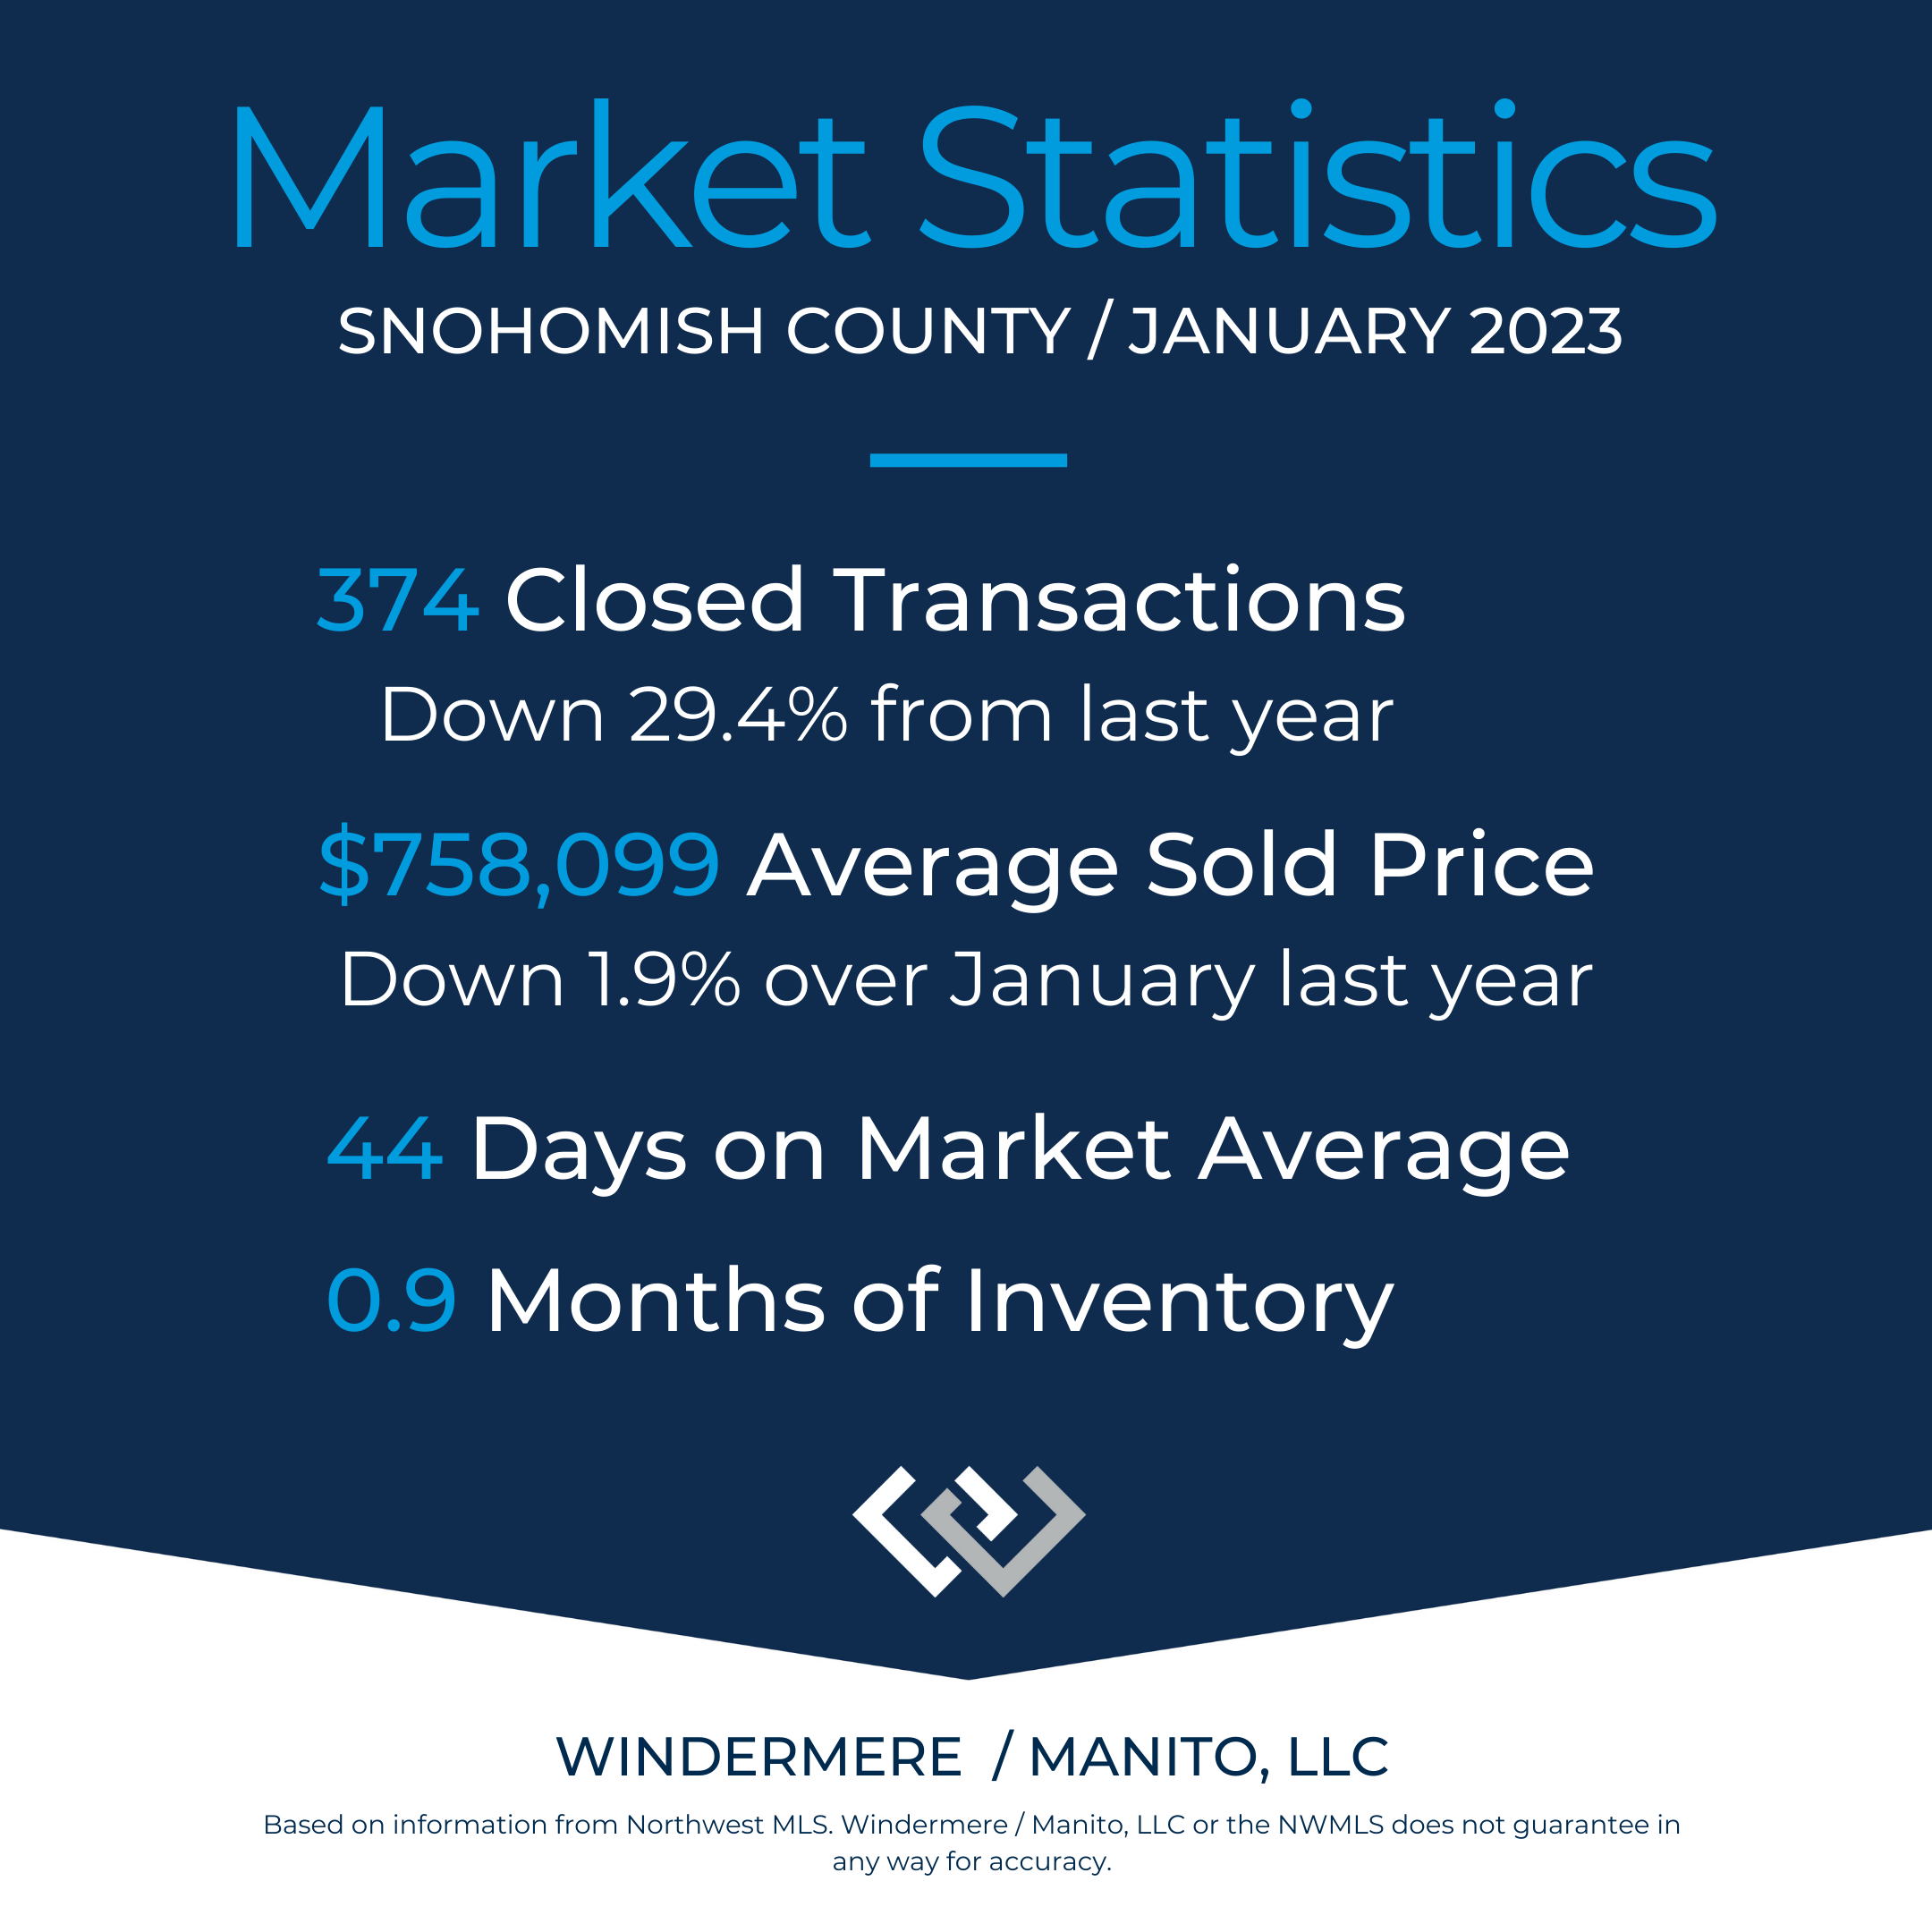
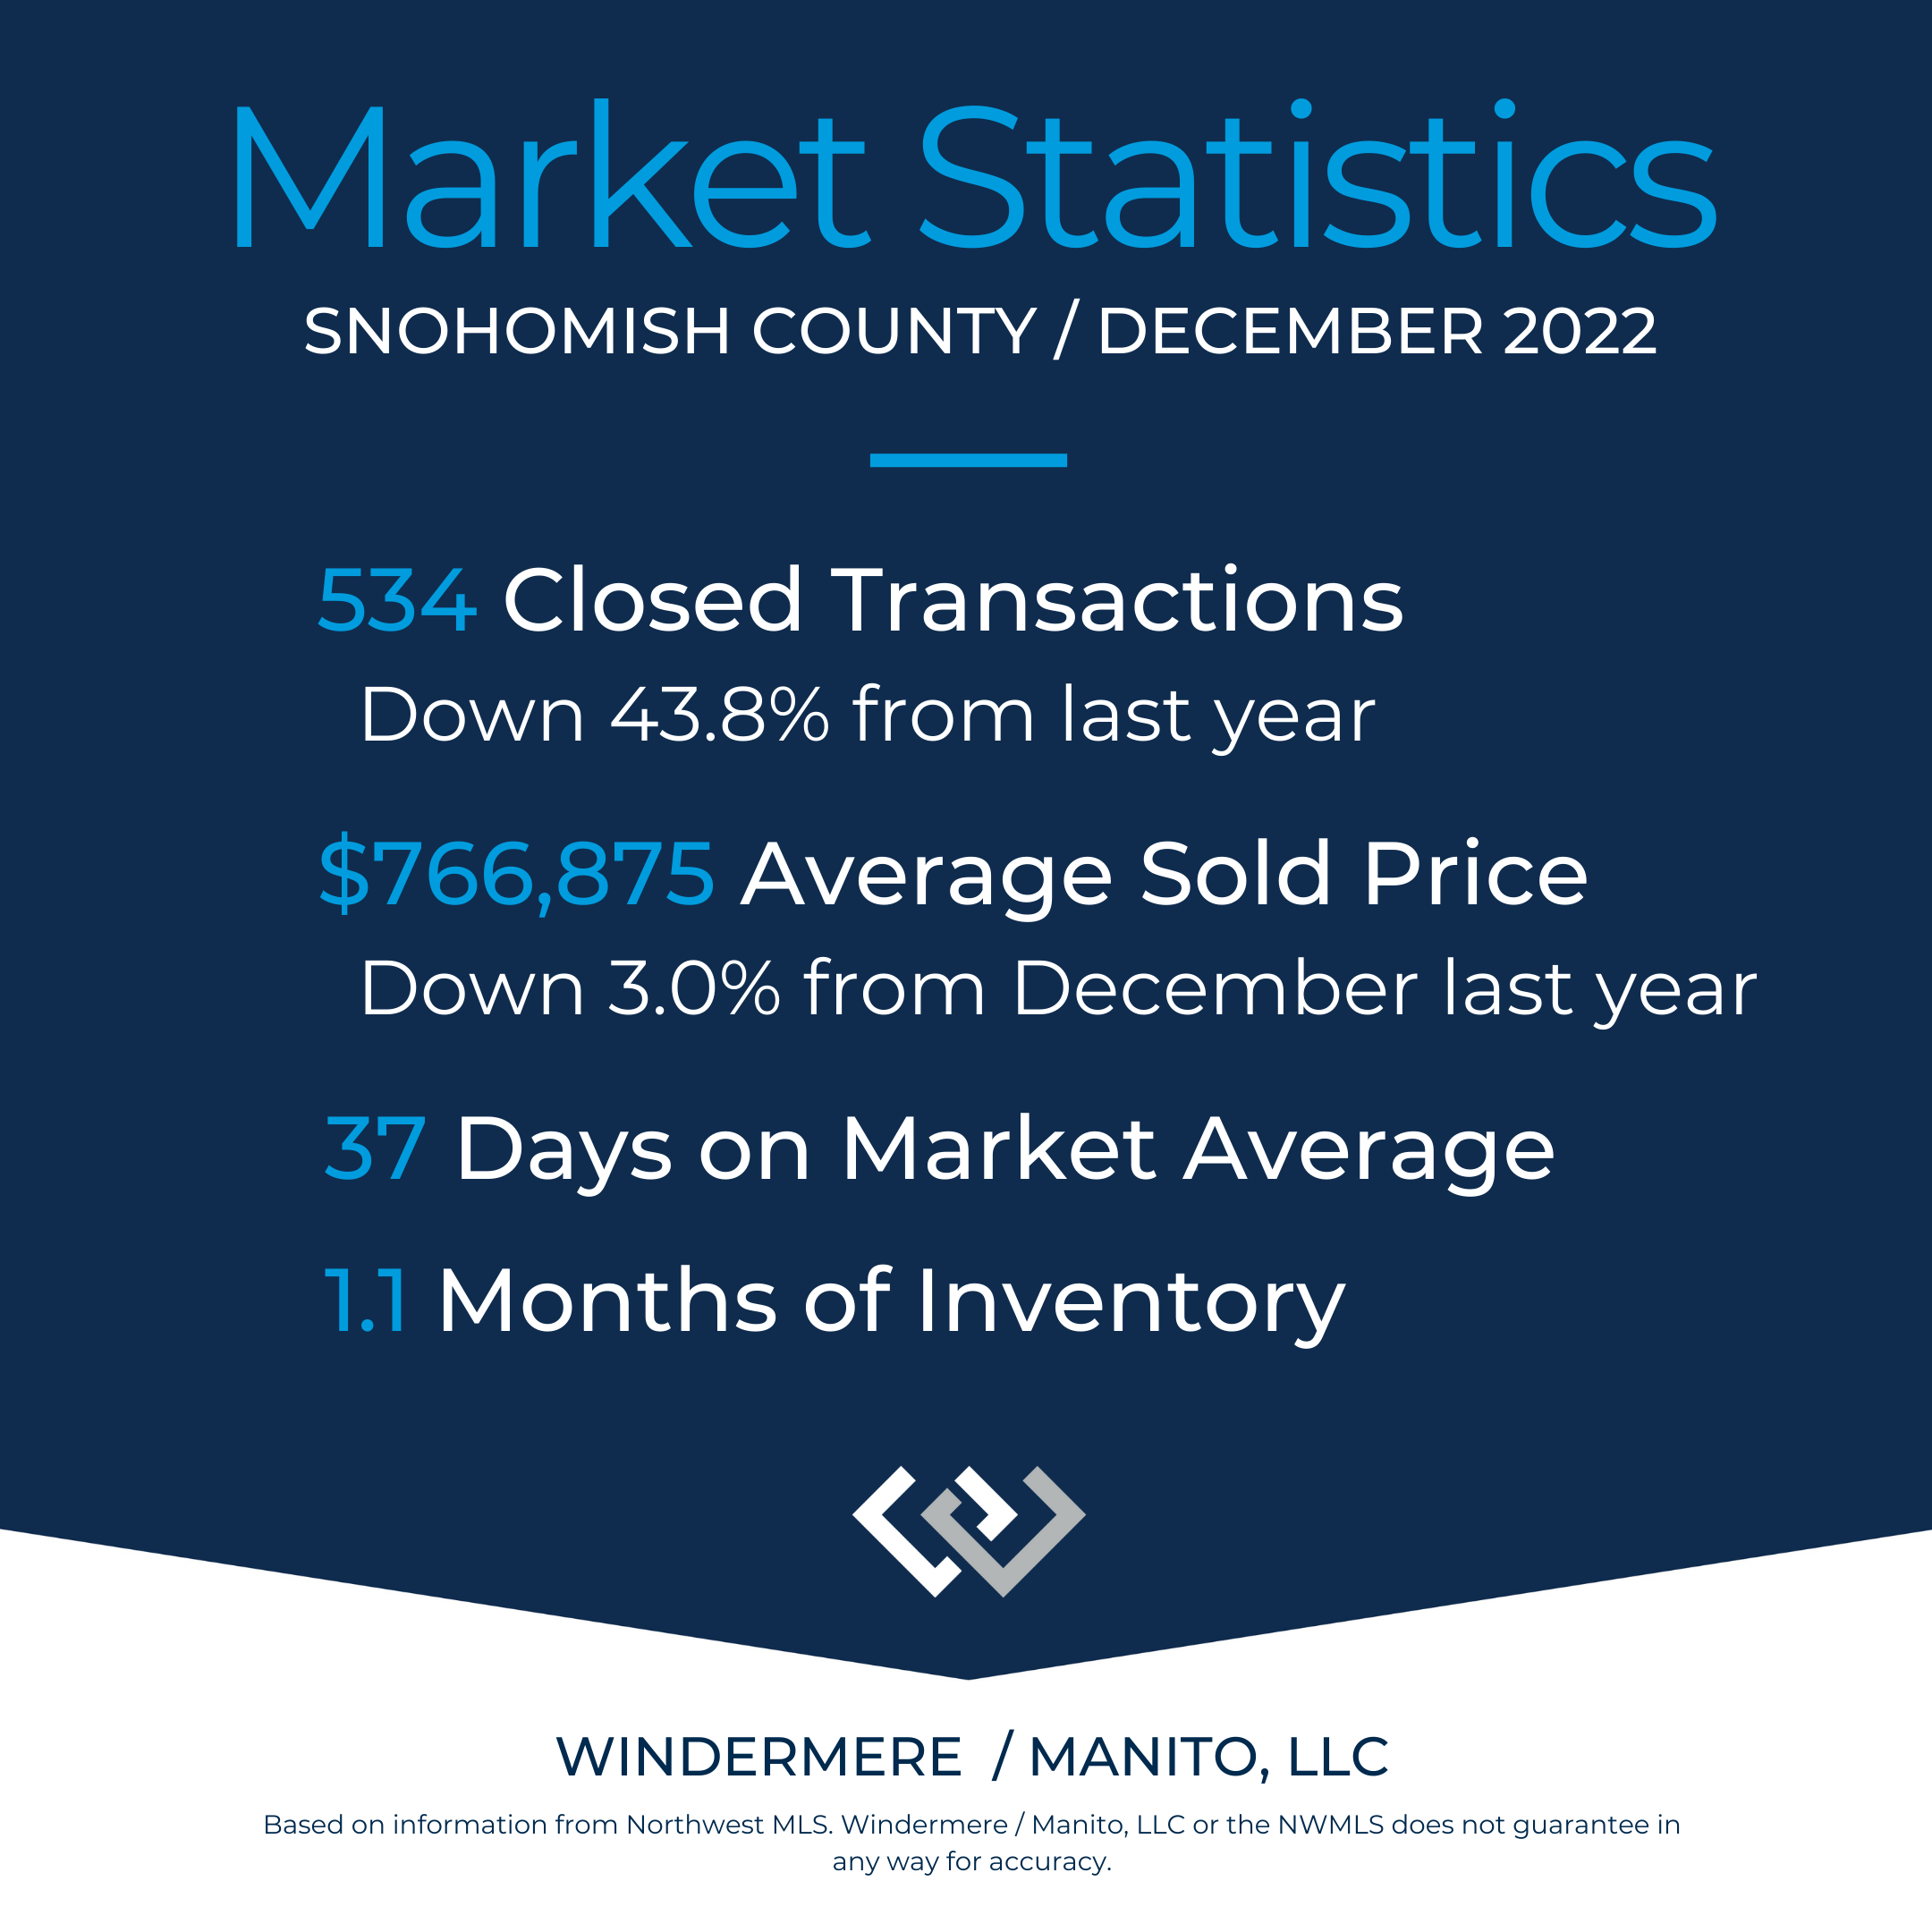
Snohomish County Market Observations - Q1 2023
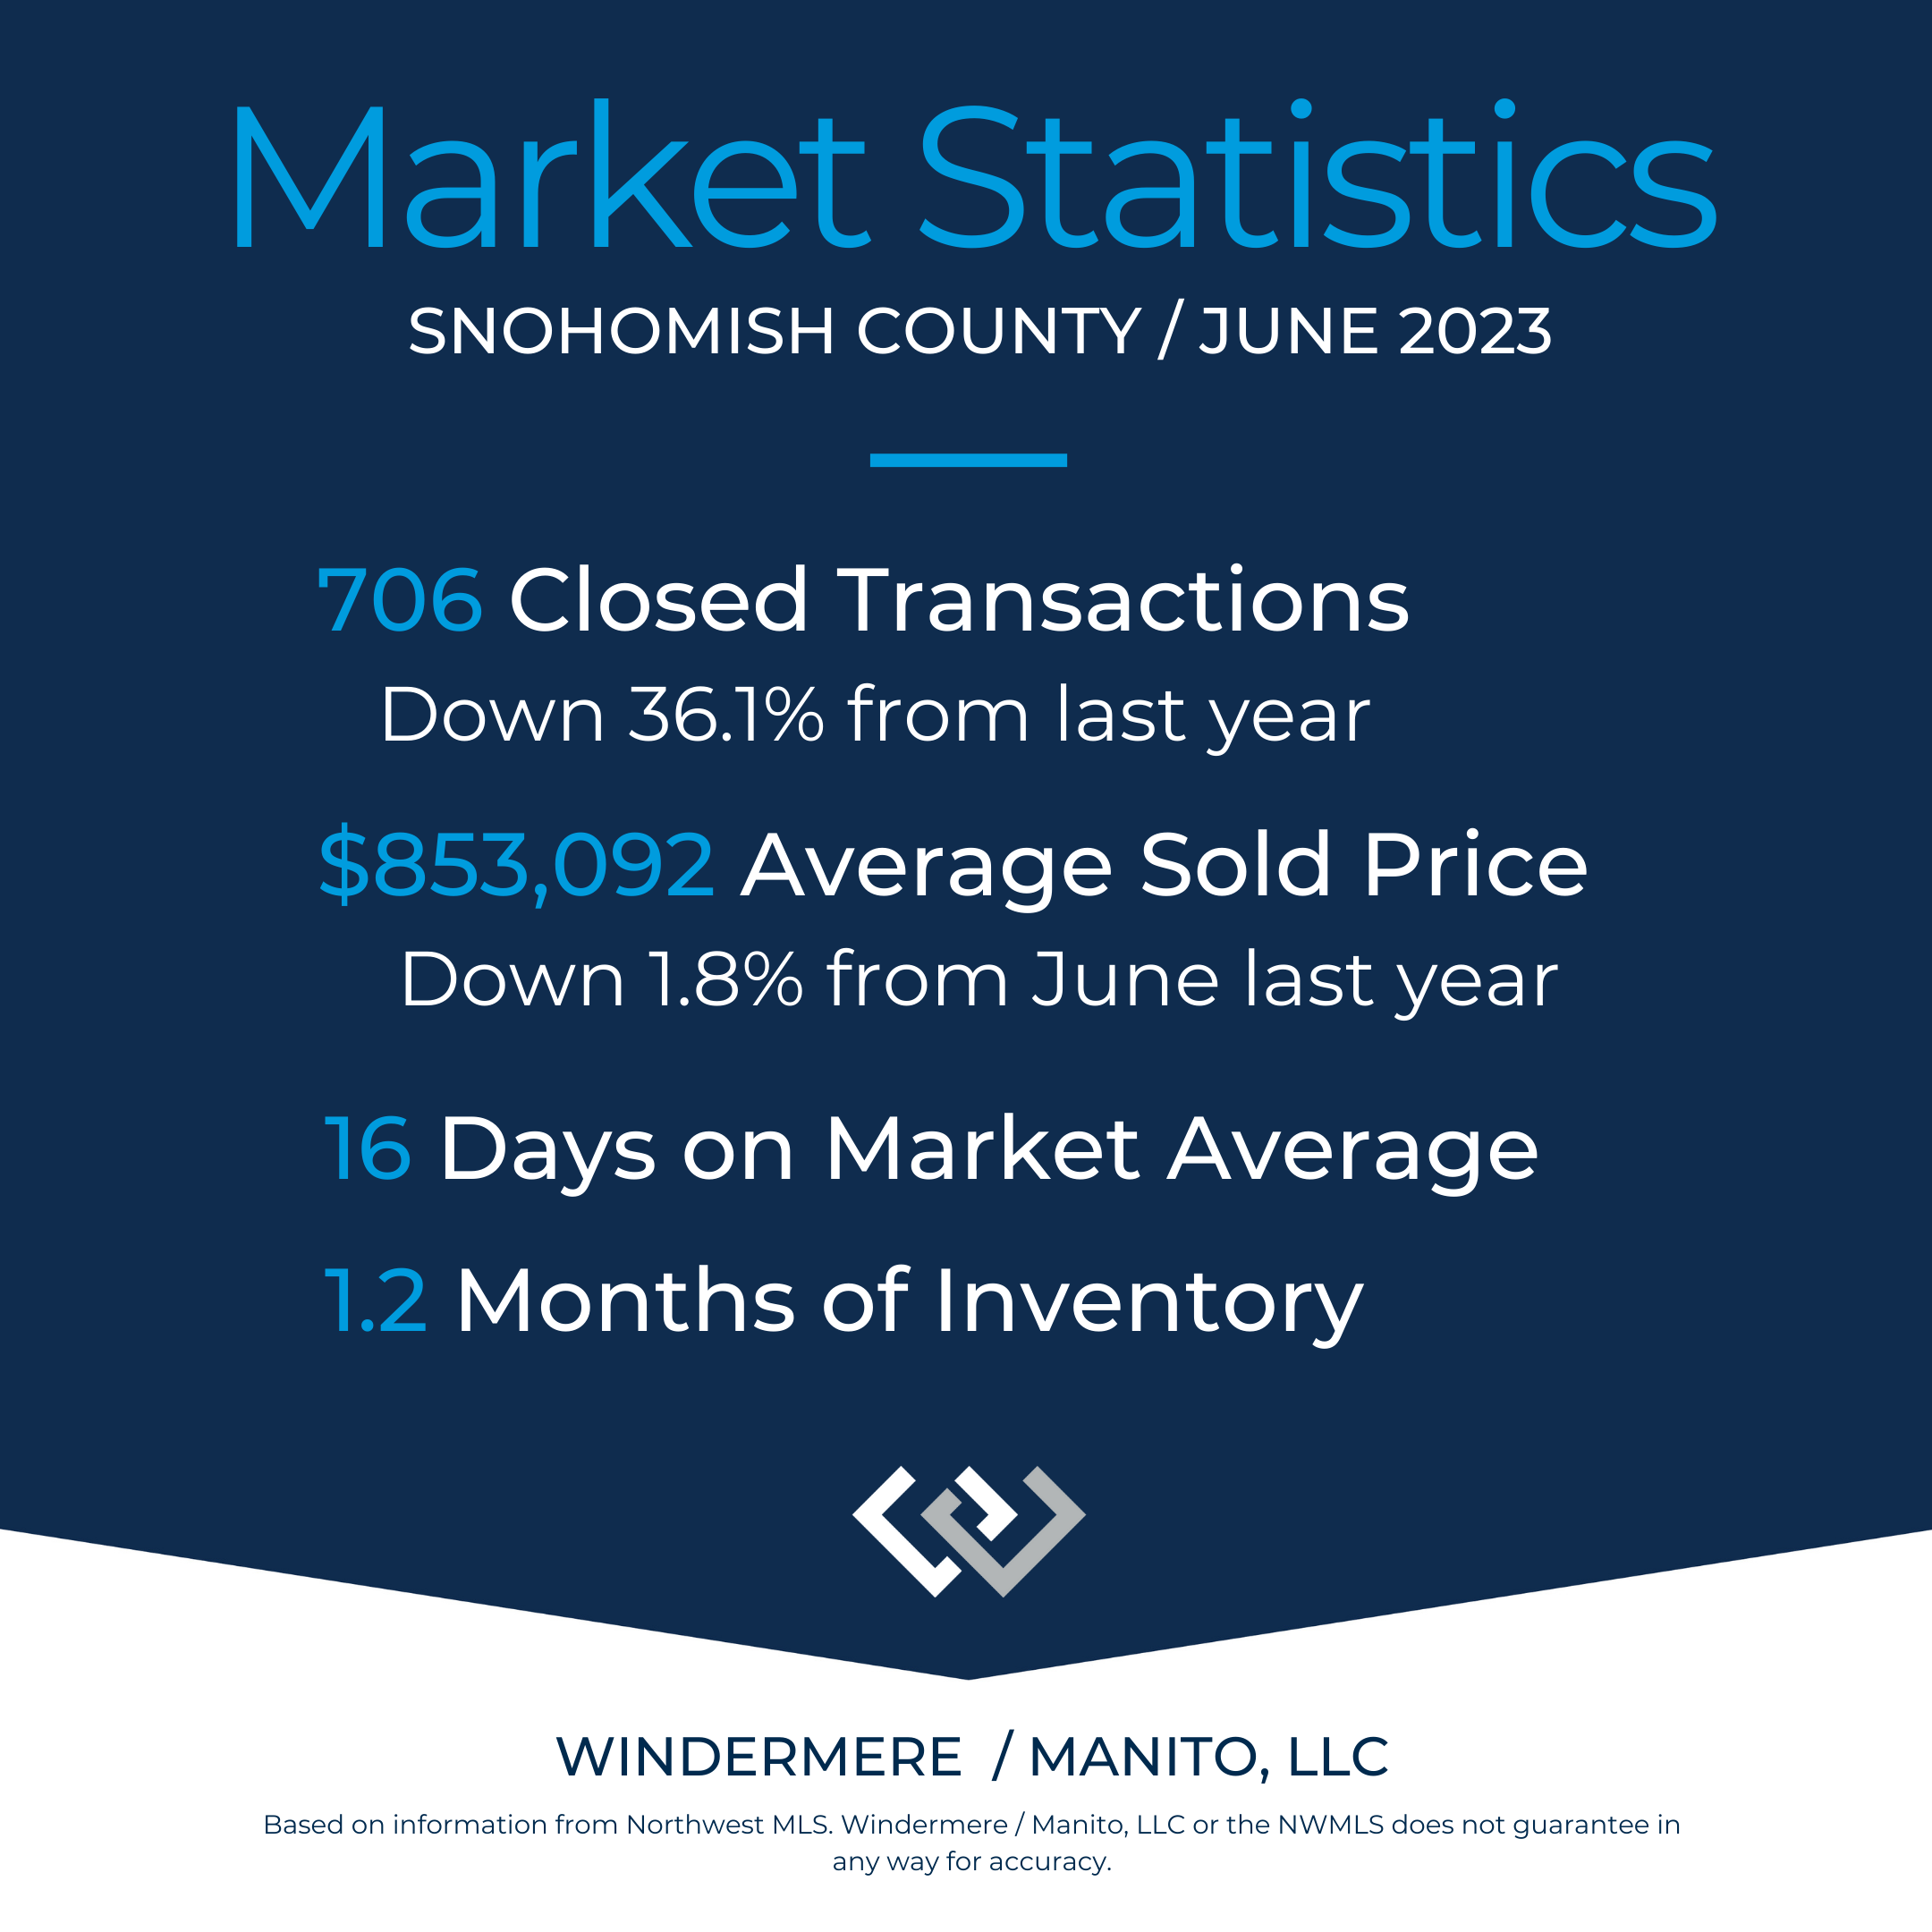
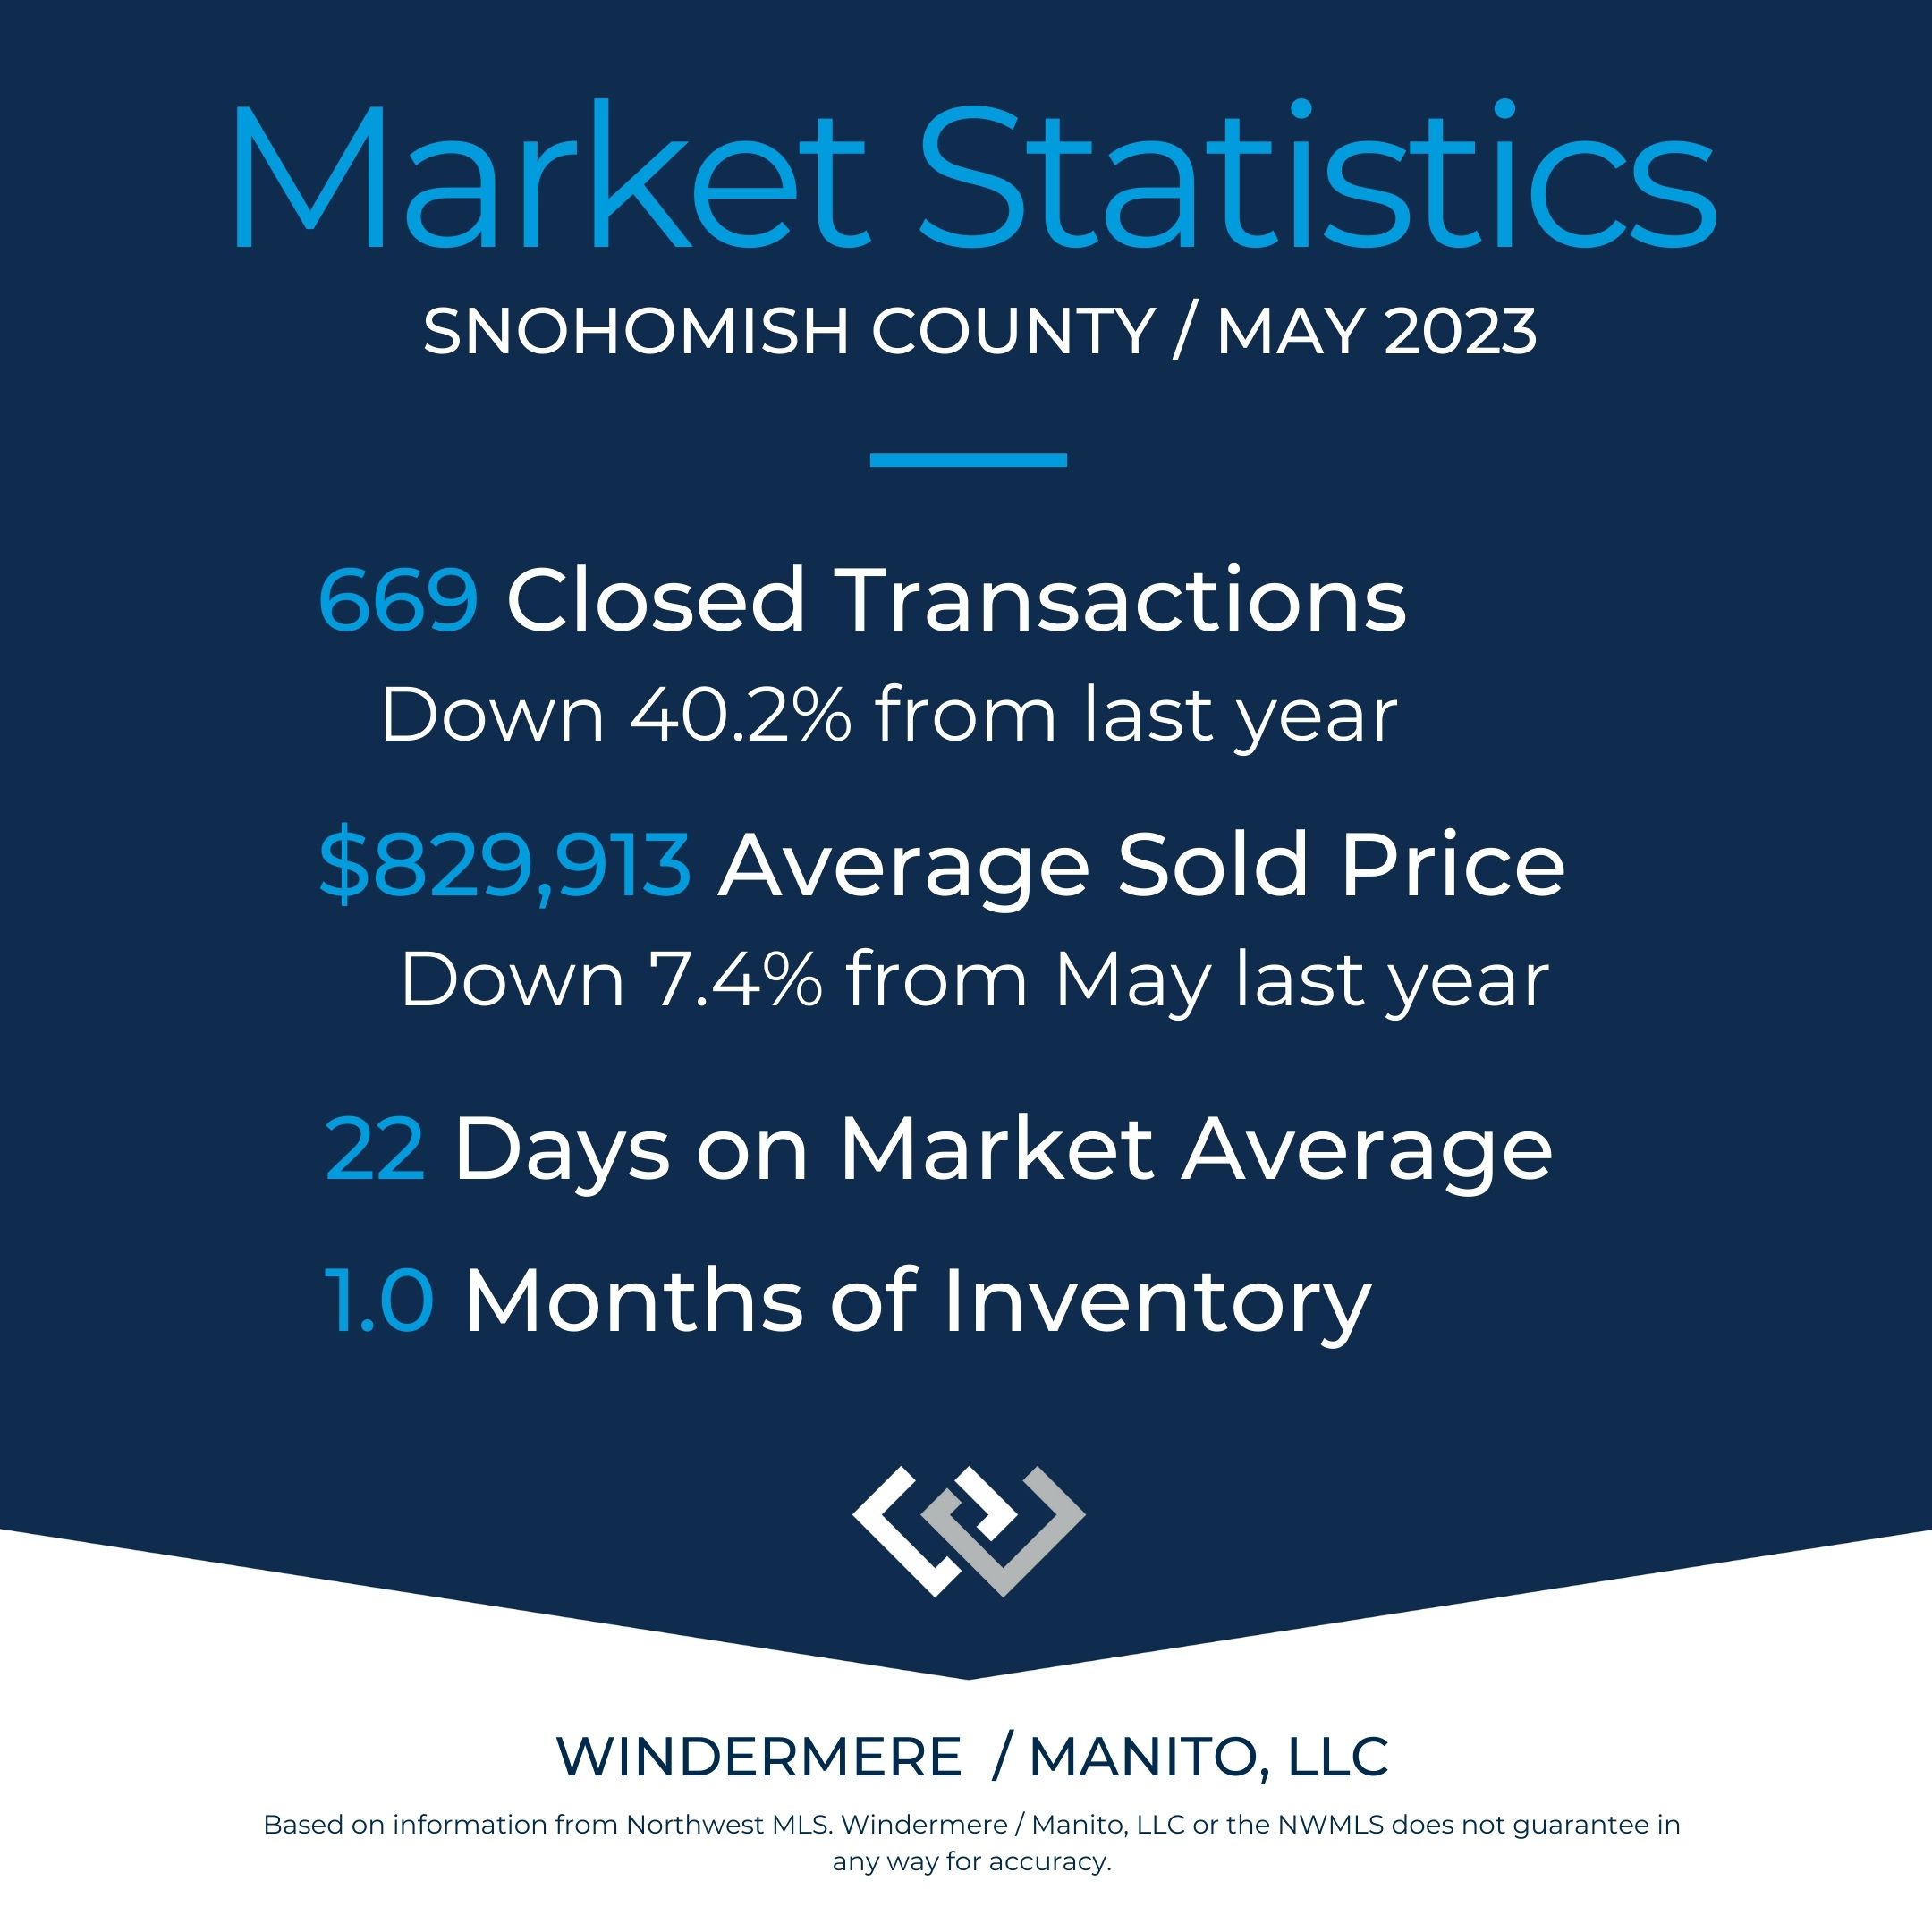
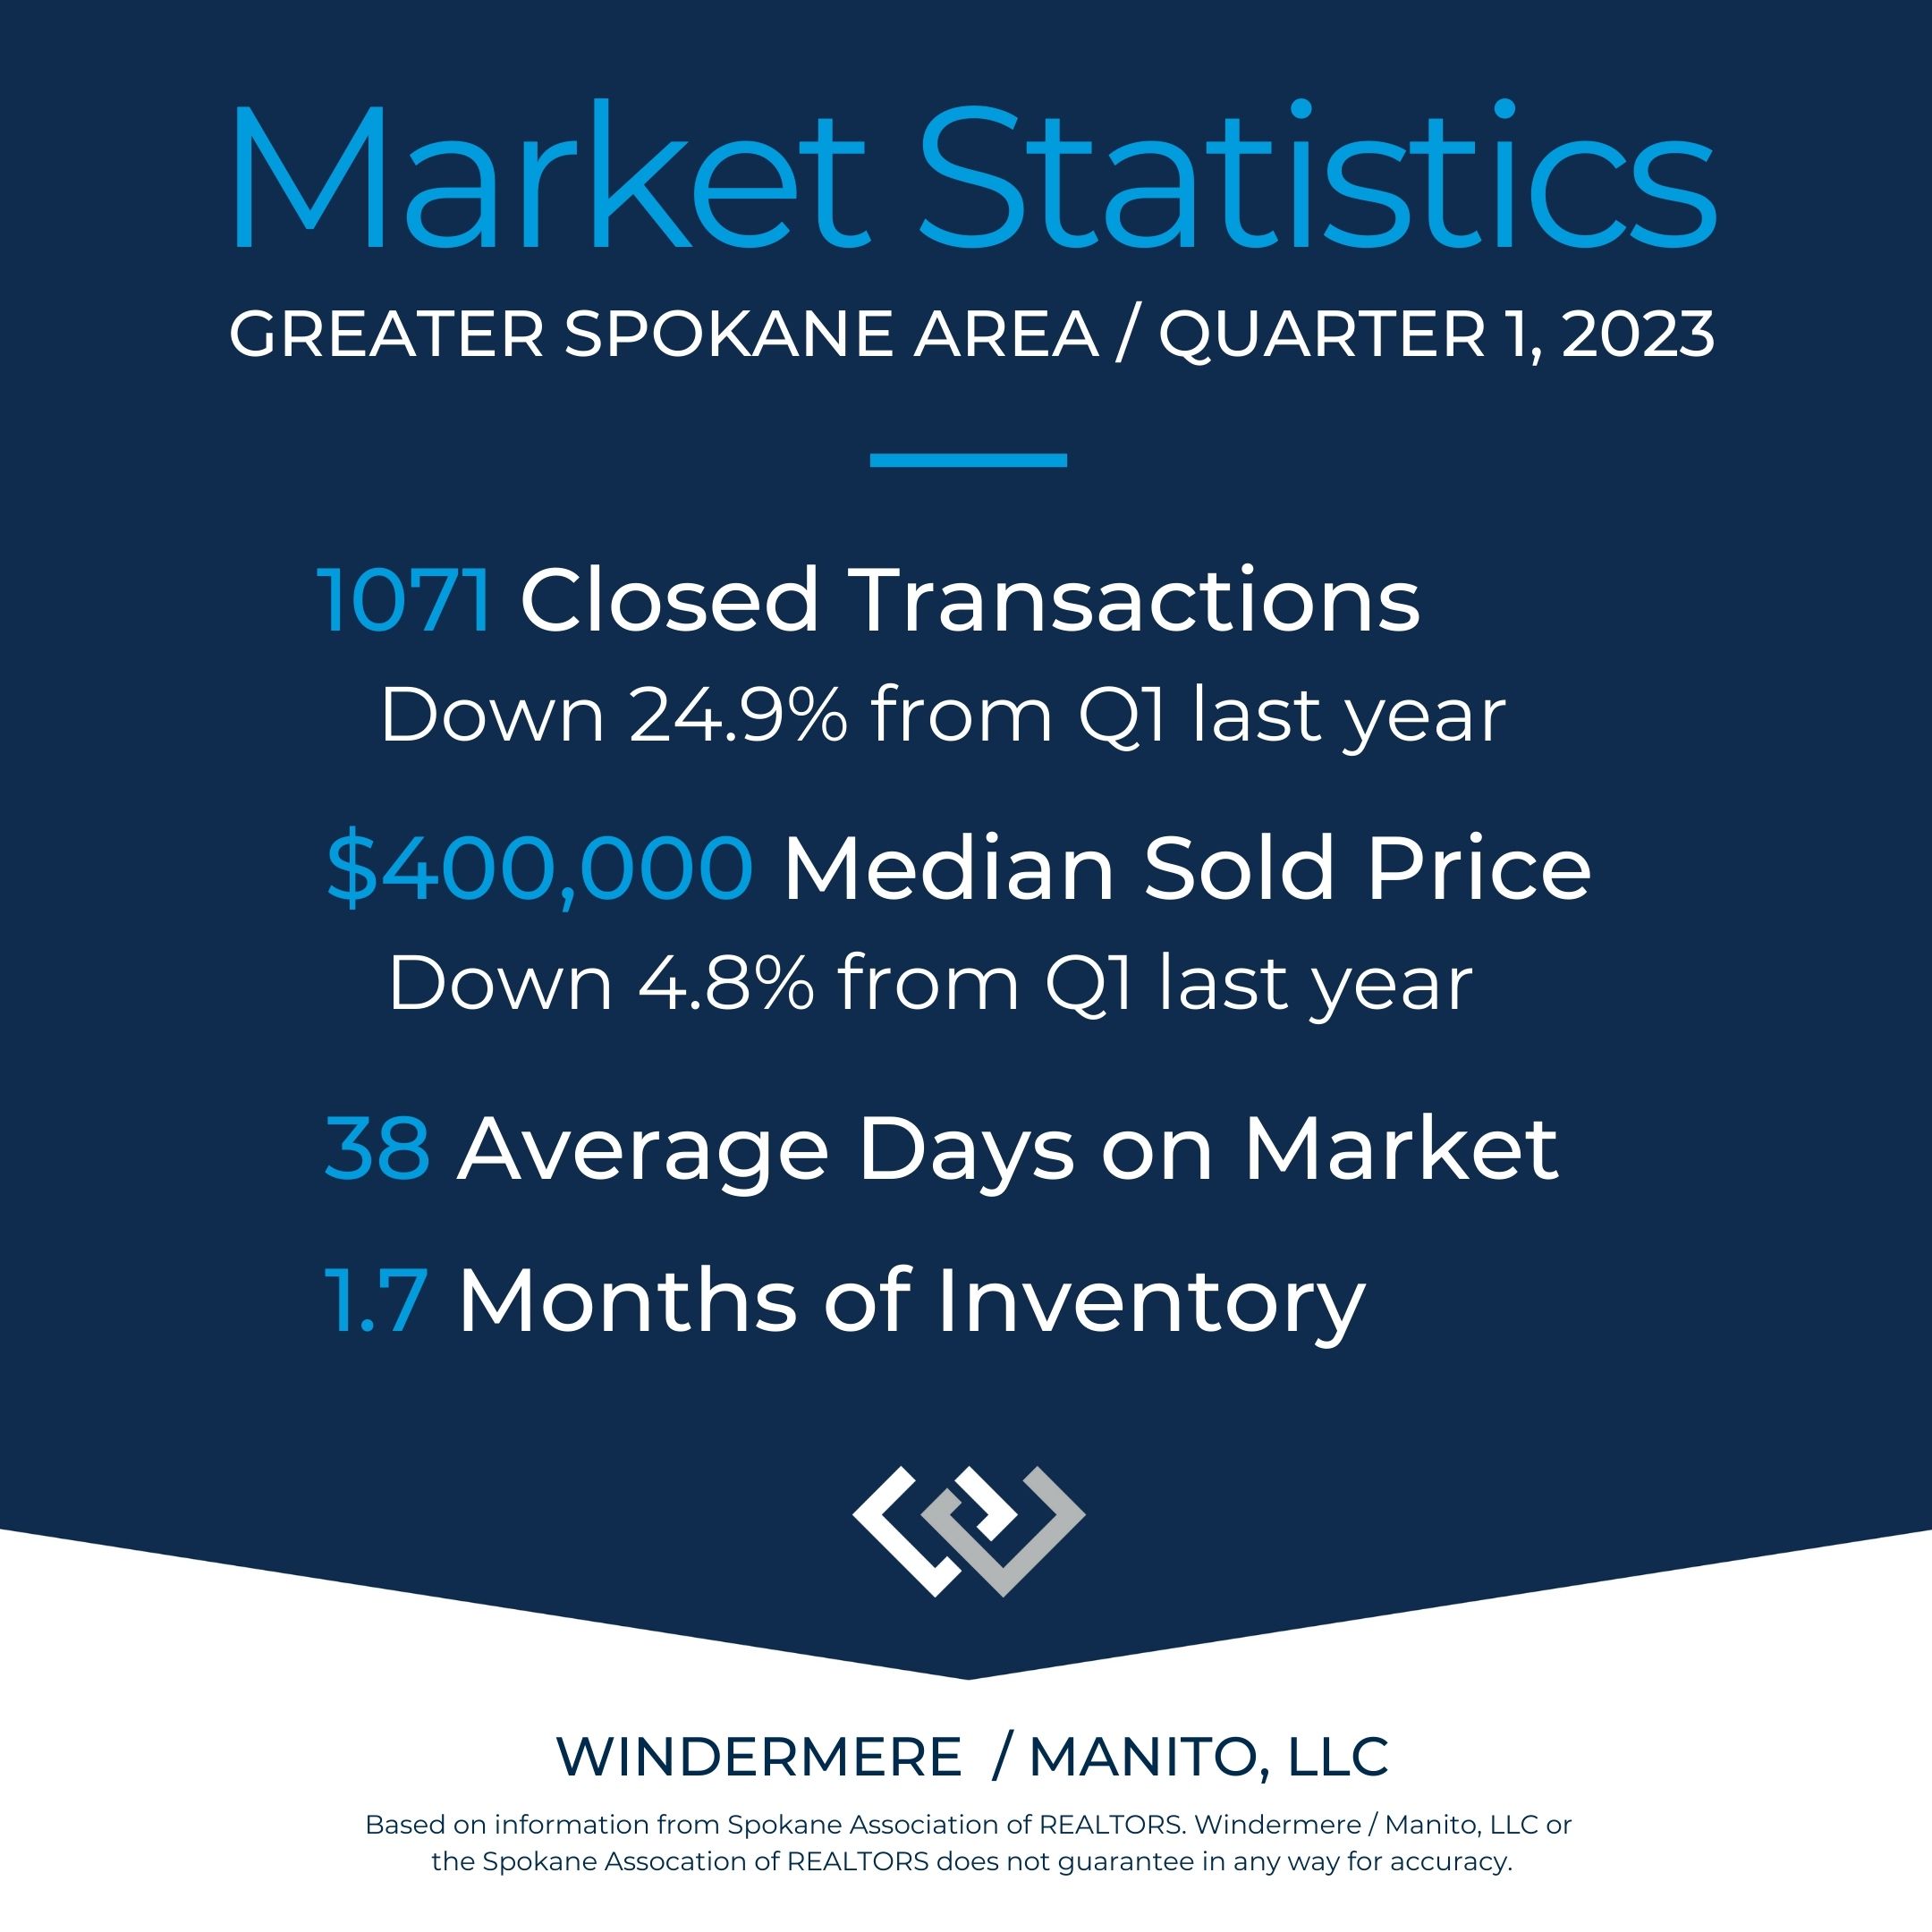
There have been some changes comparing Q1 this year to last.
Part of the data story not shown on this summary is that new listings are down 34.2% compared to the first quarter of 2022. That "shortage" trickles through, one of the factors impacting the number of closed transactions.
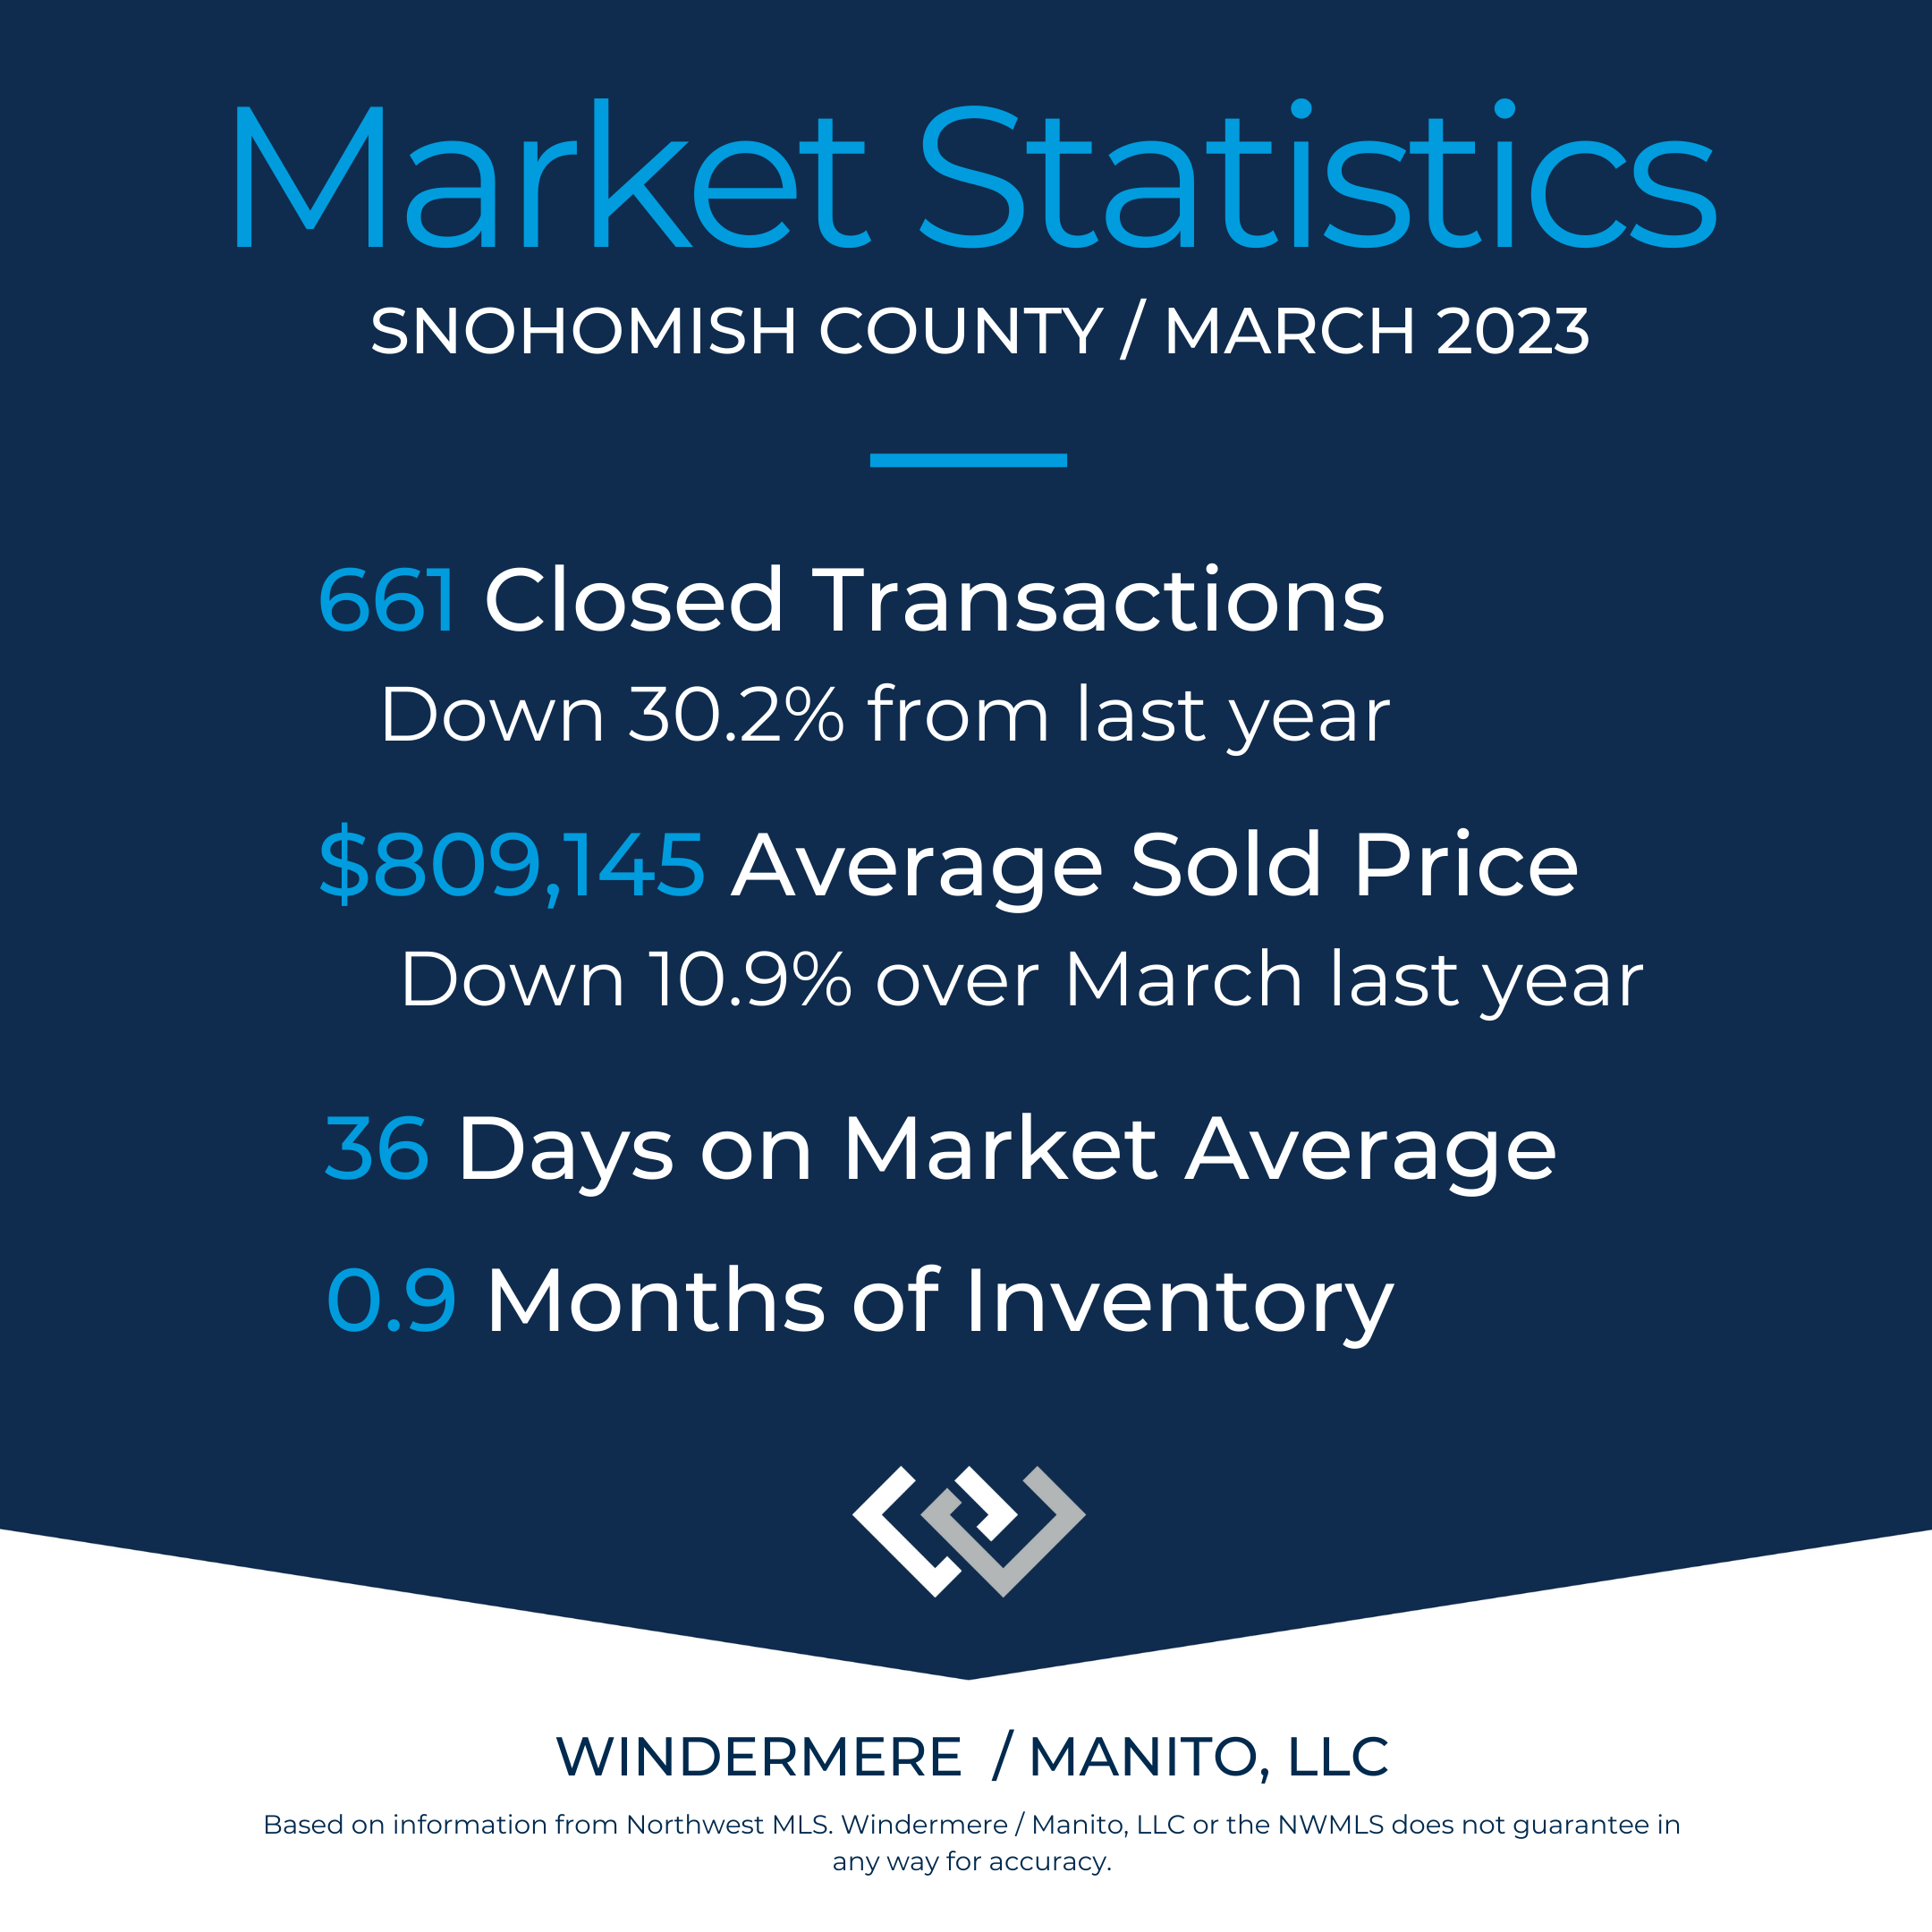
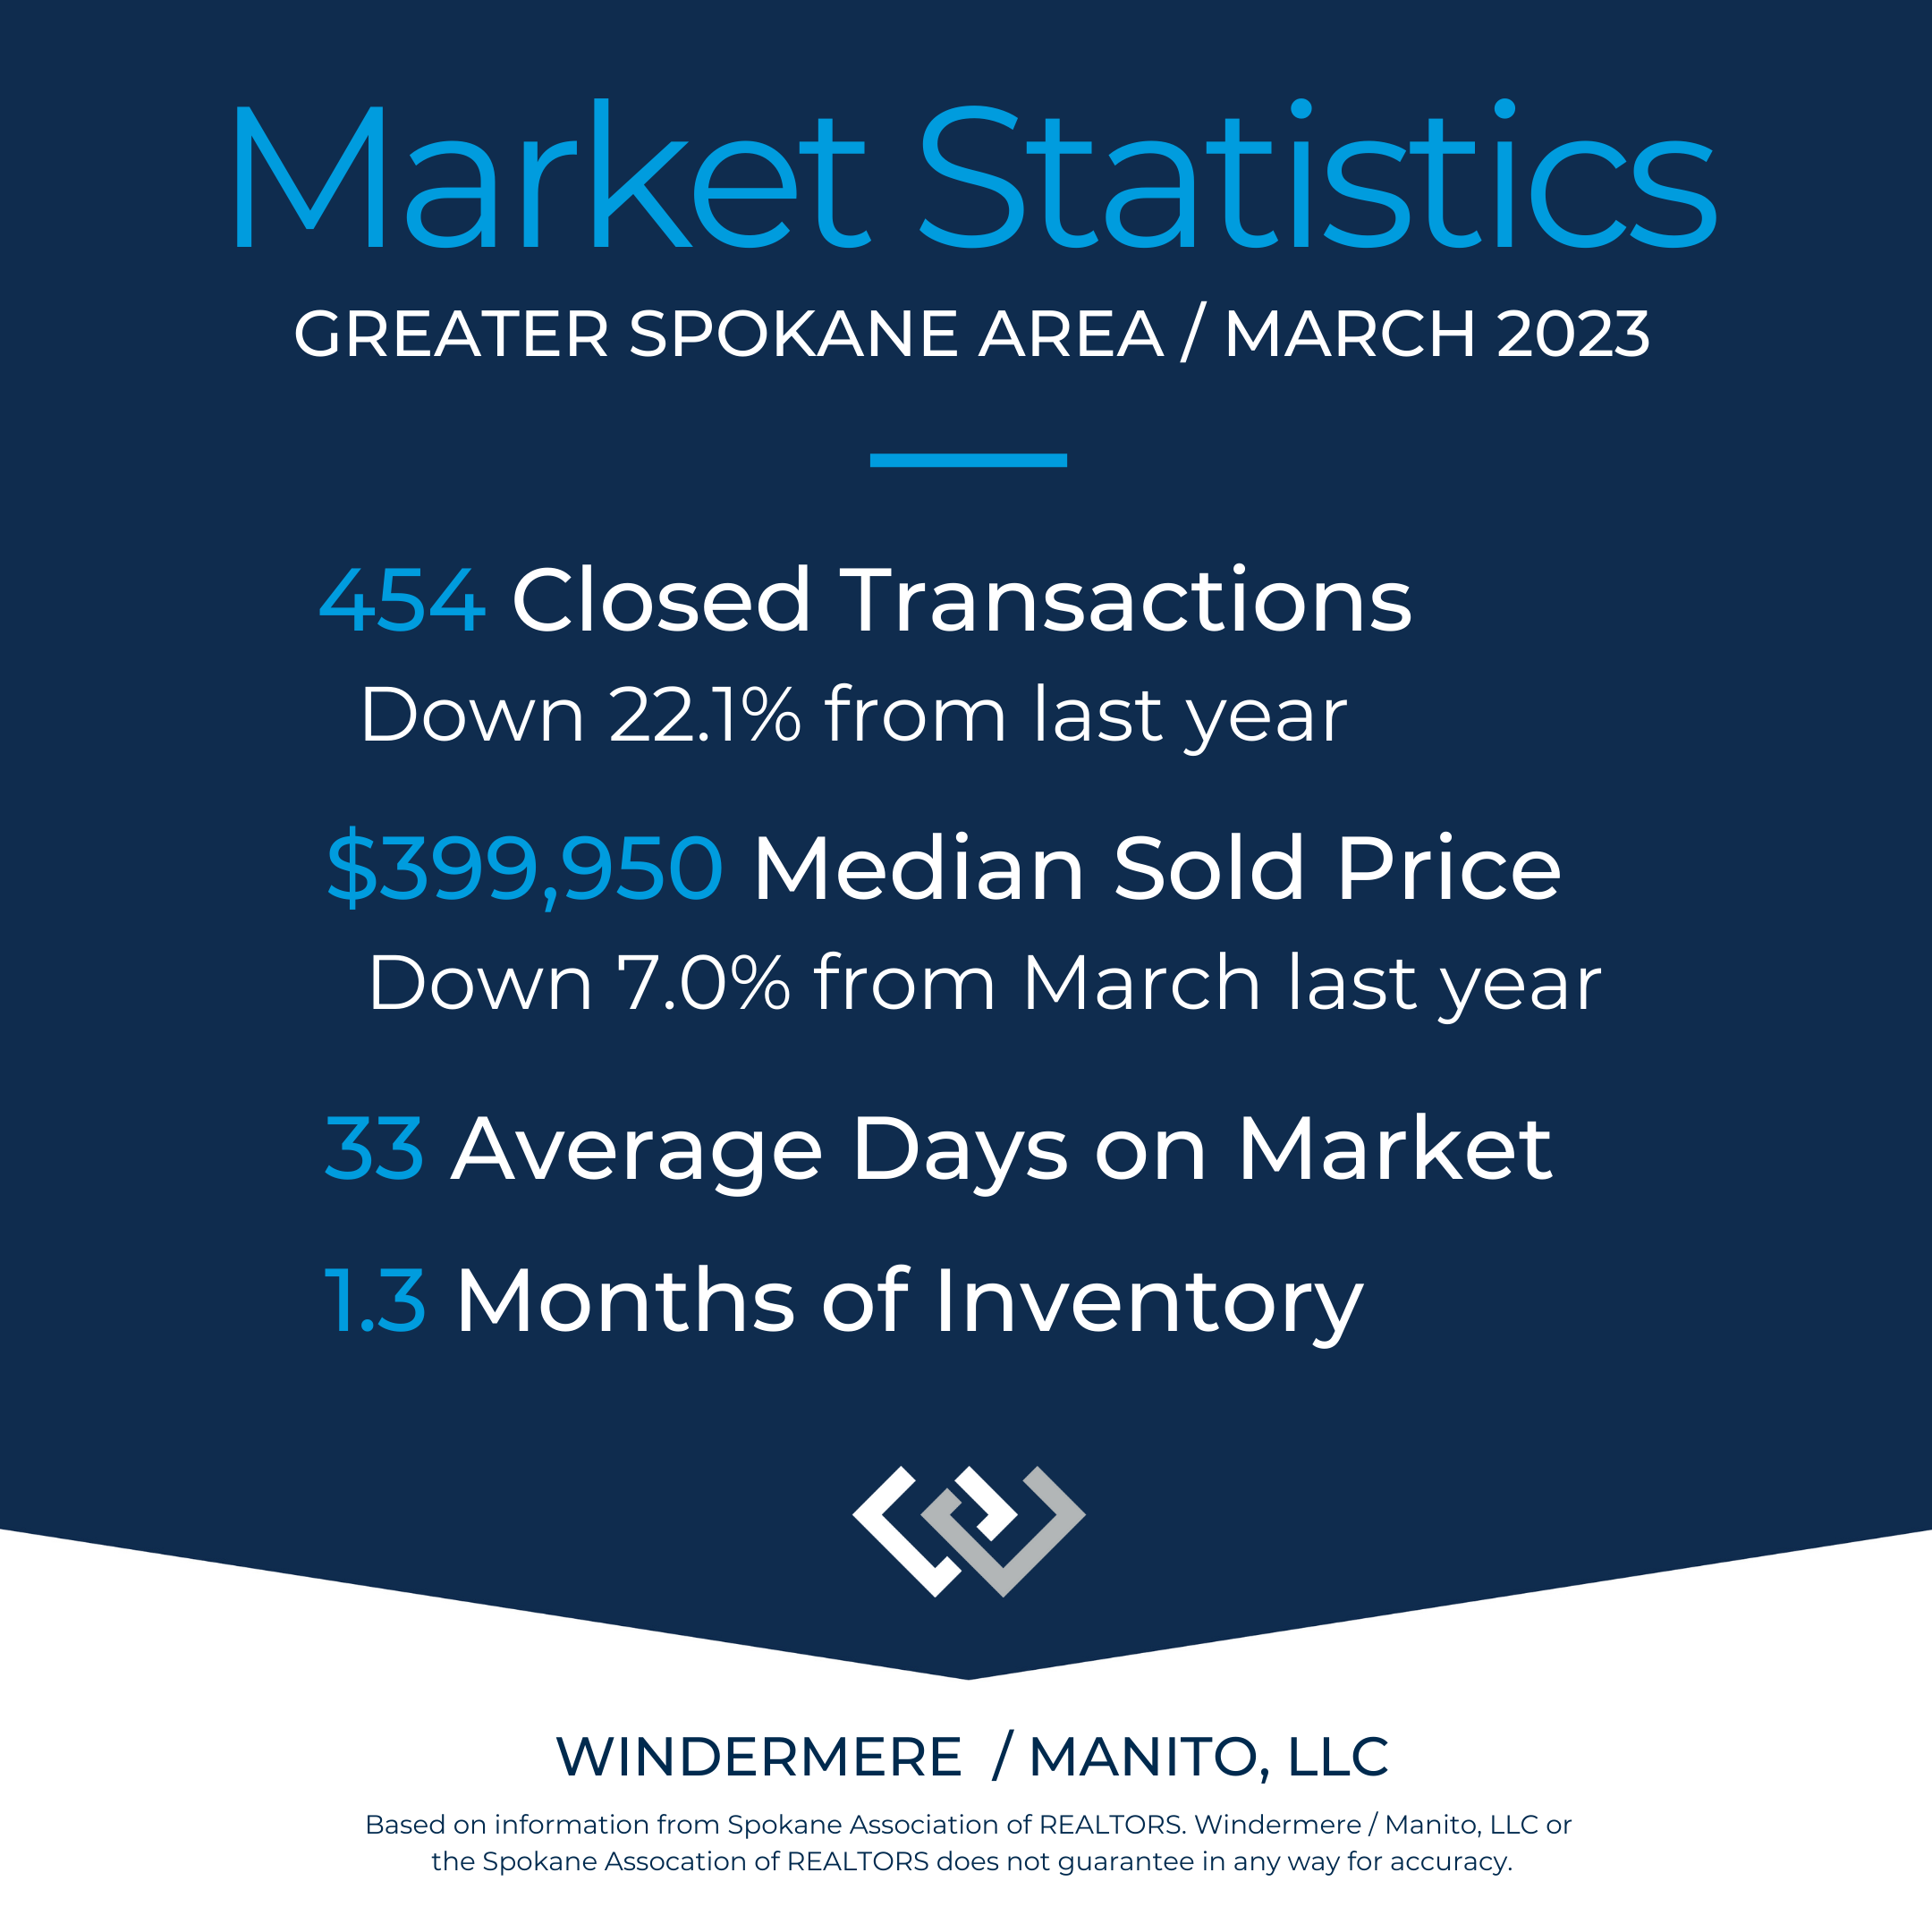
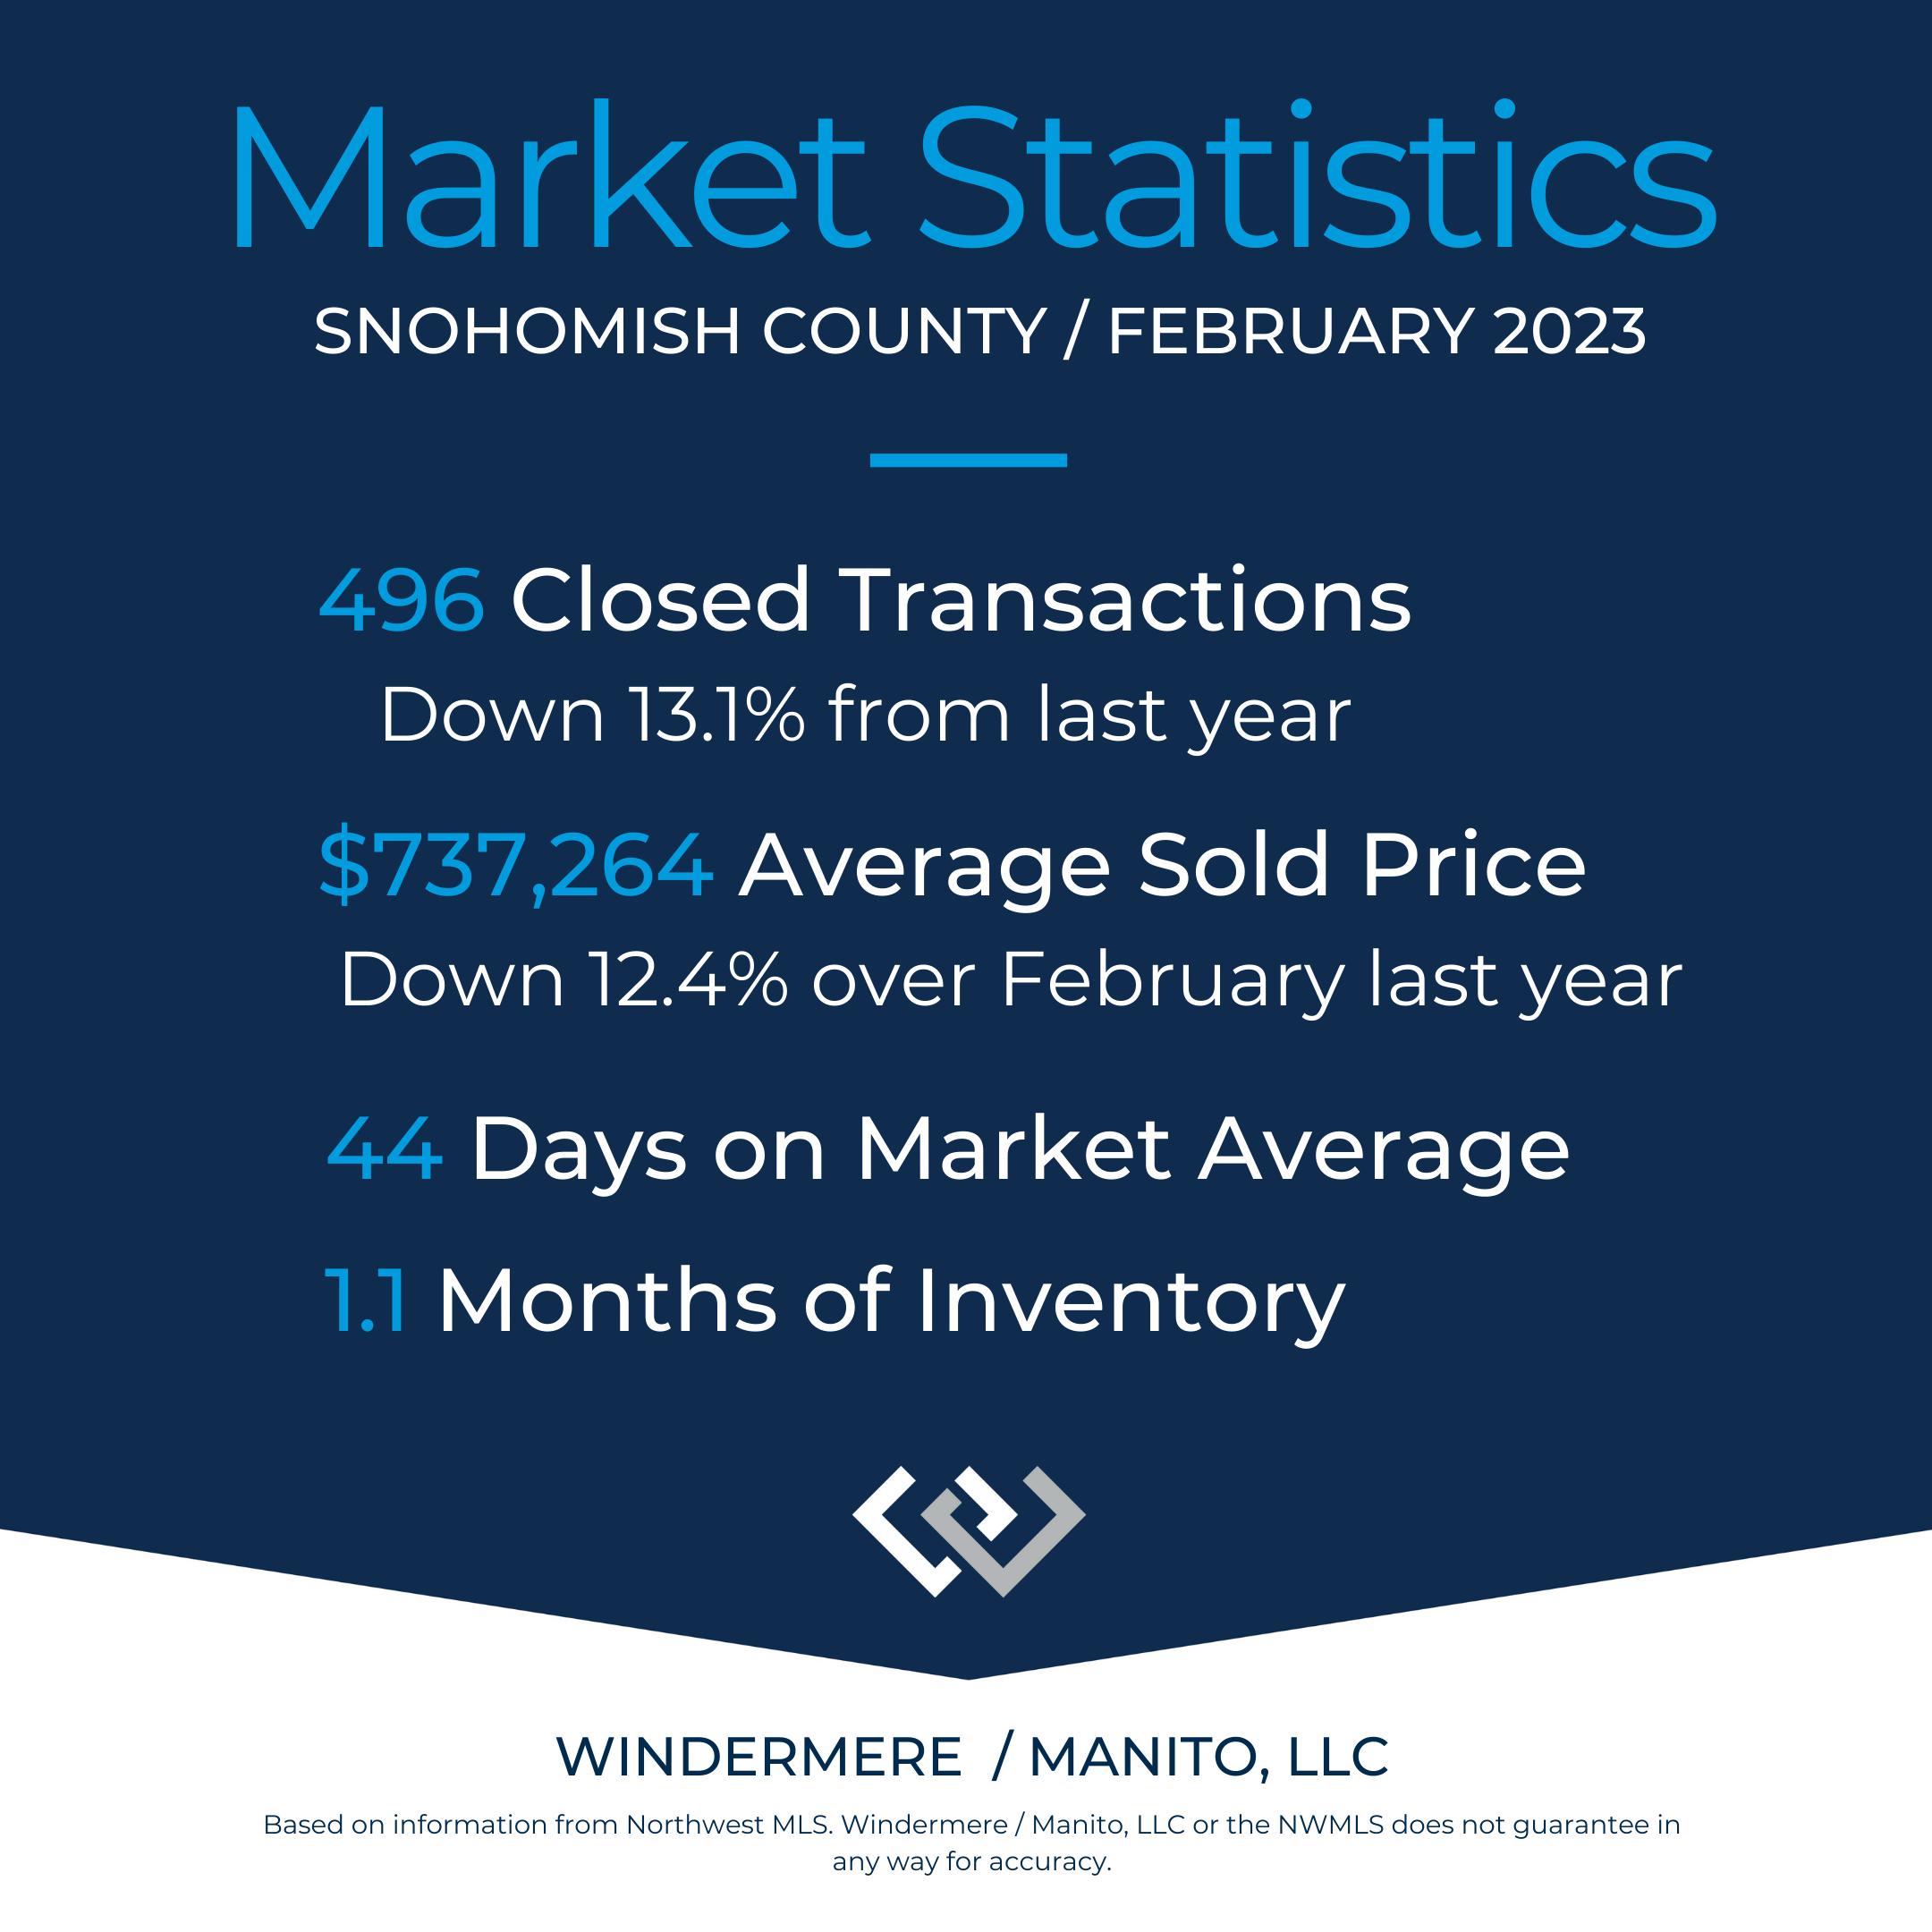
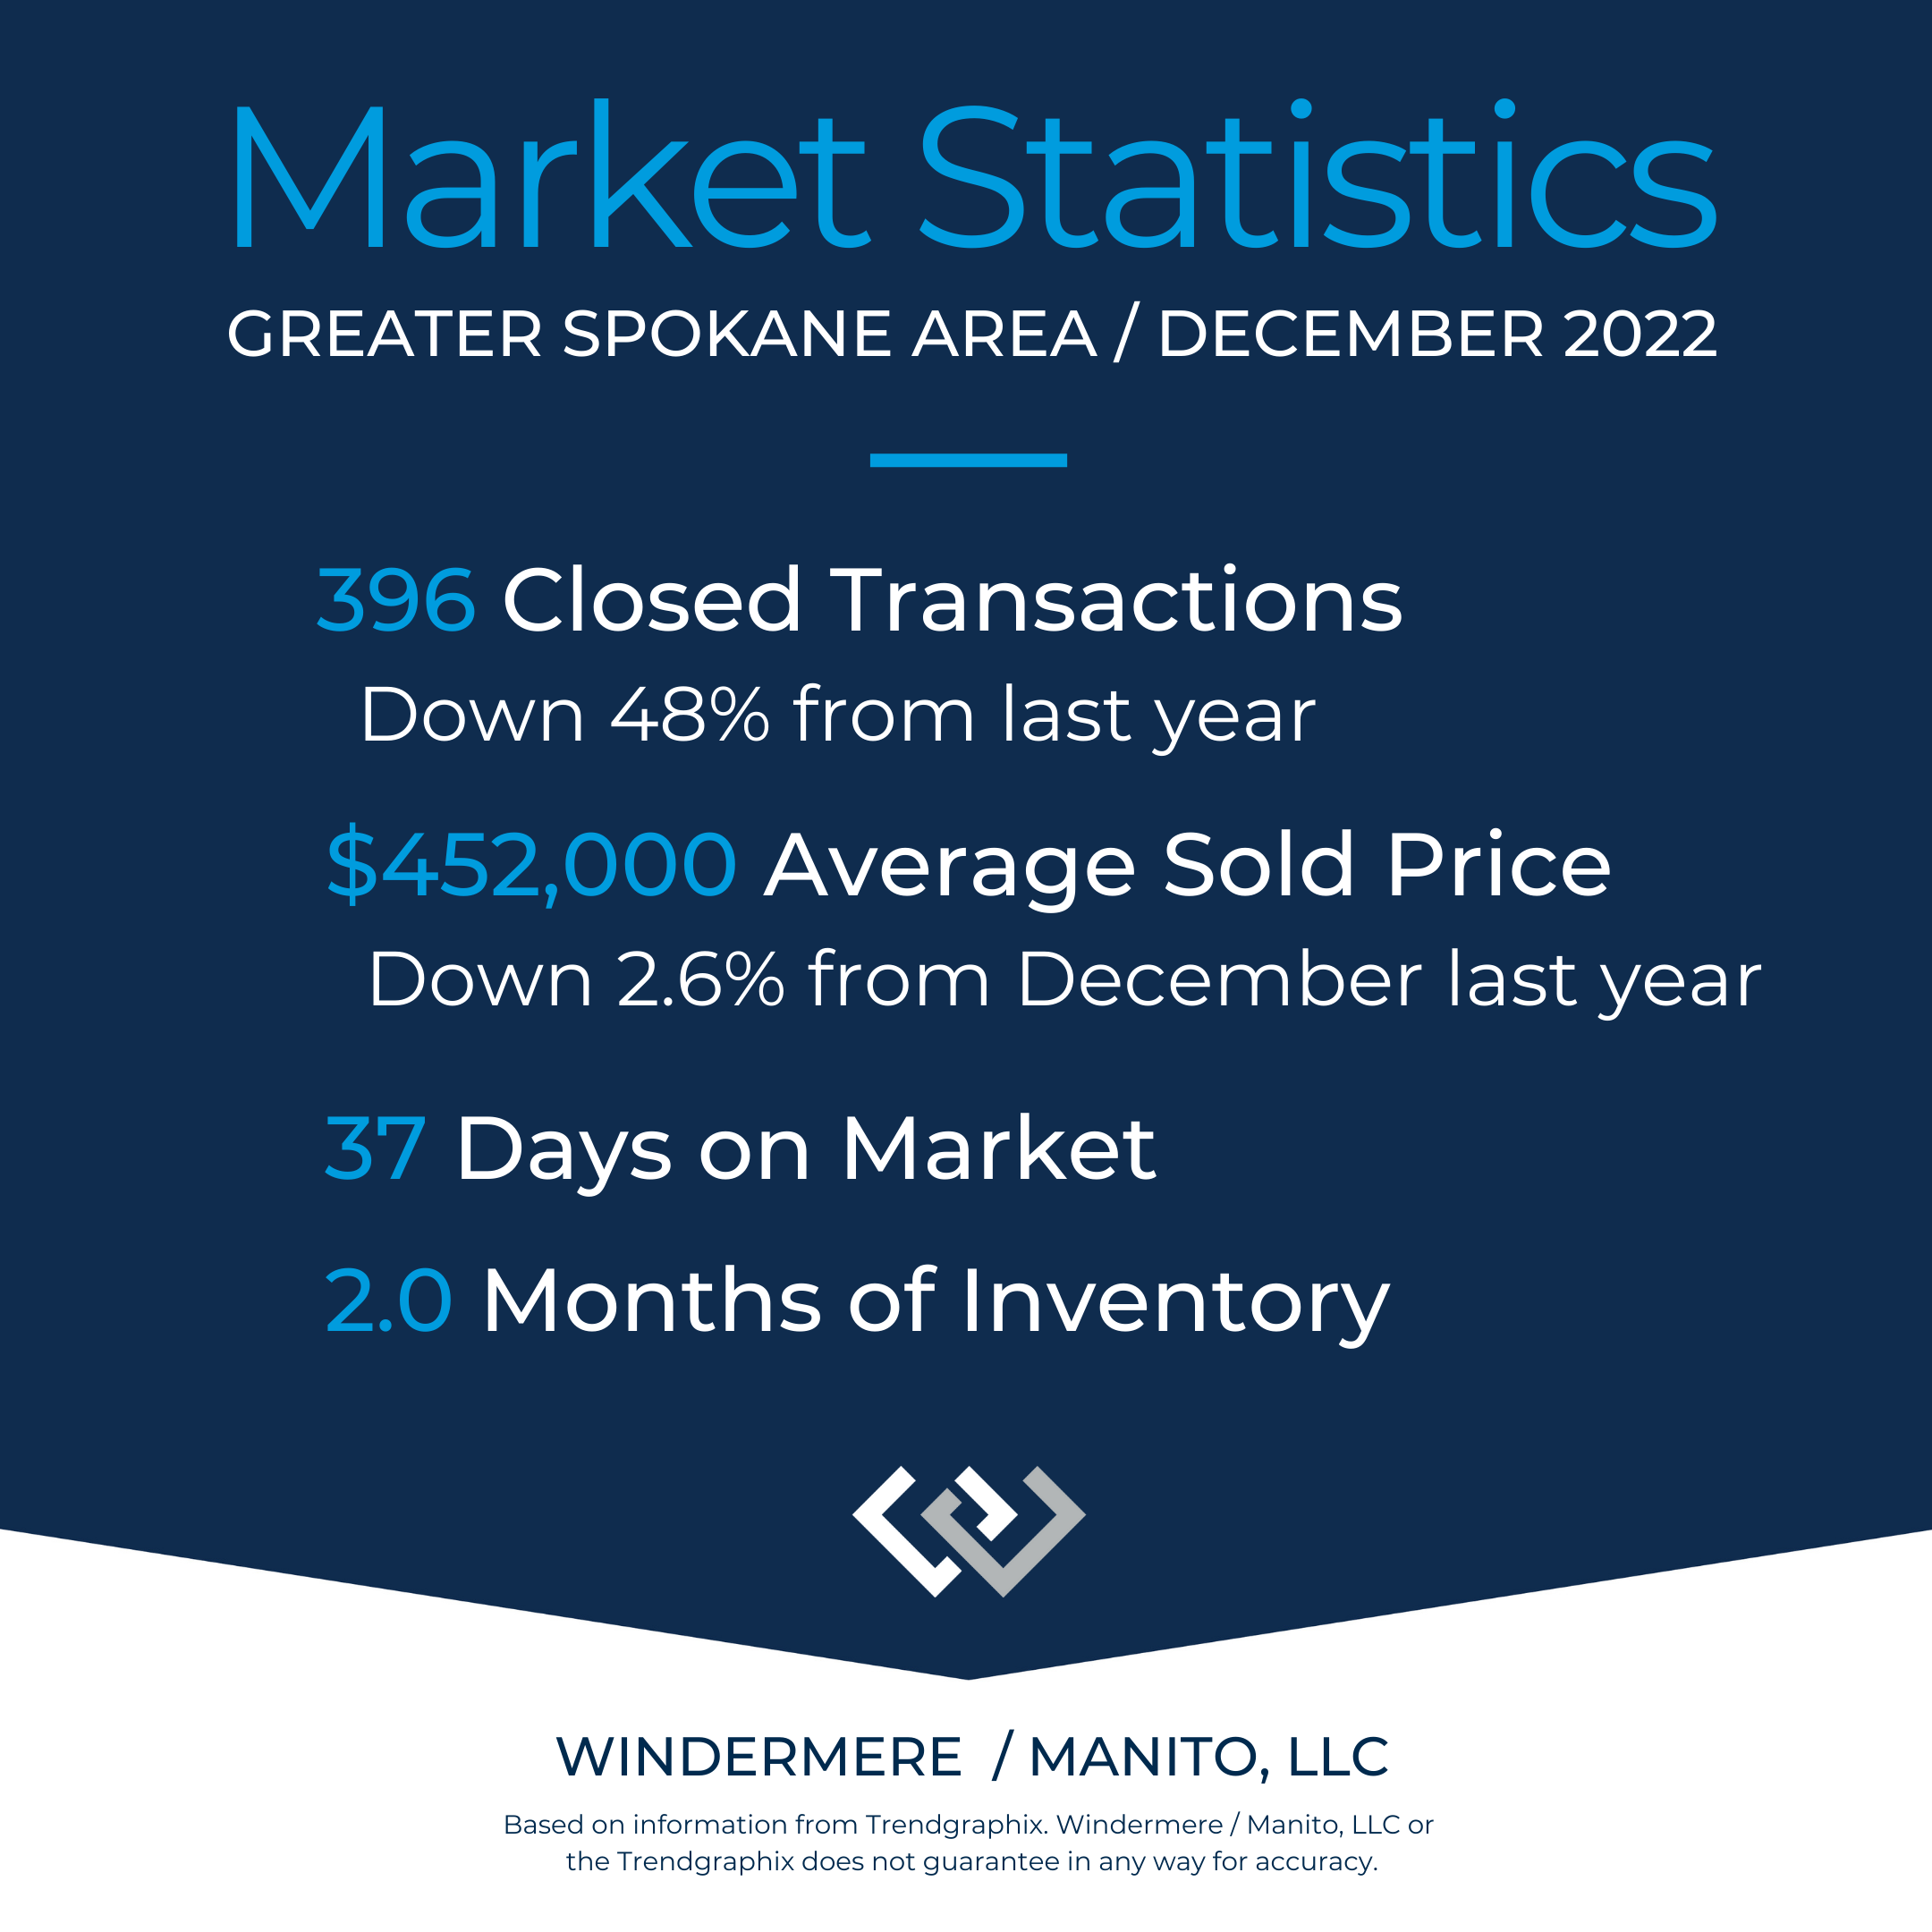
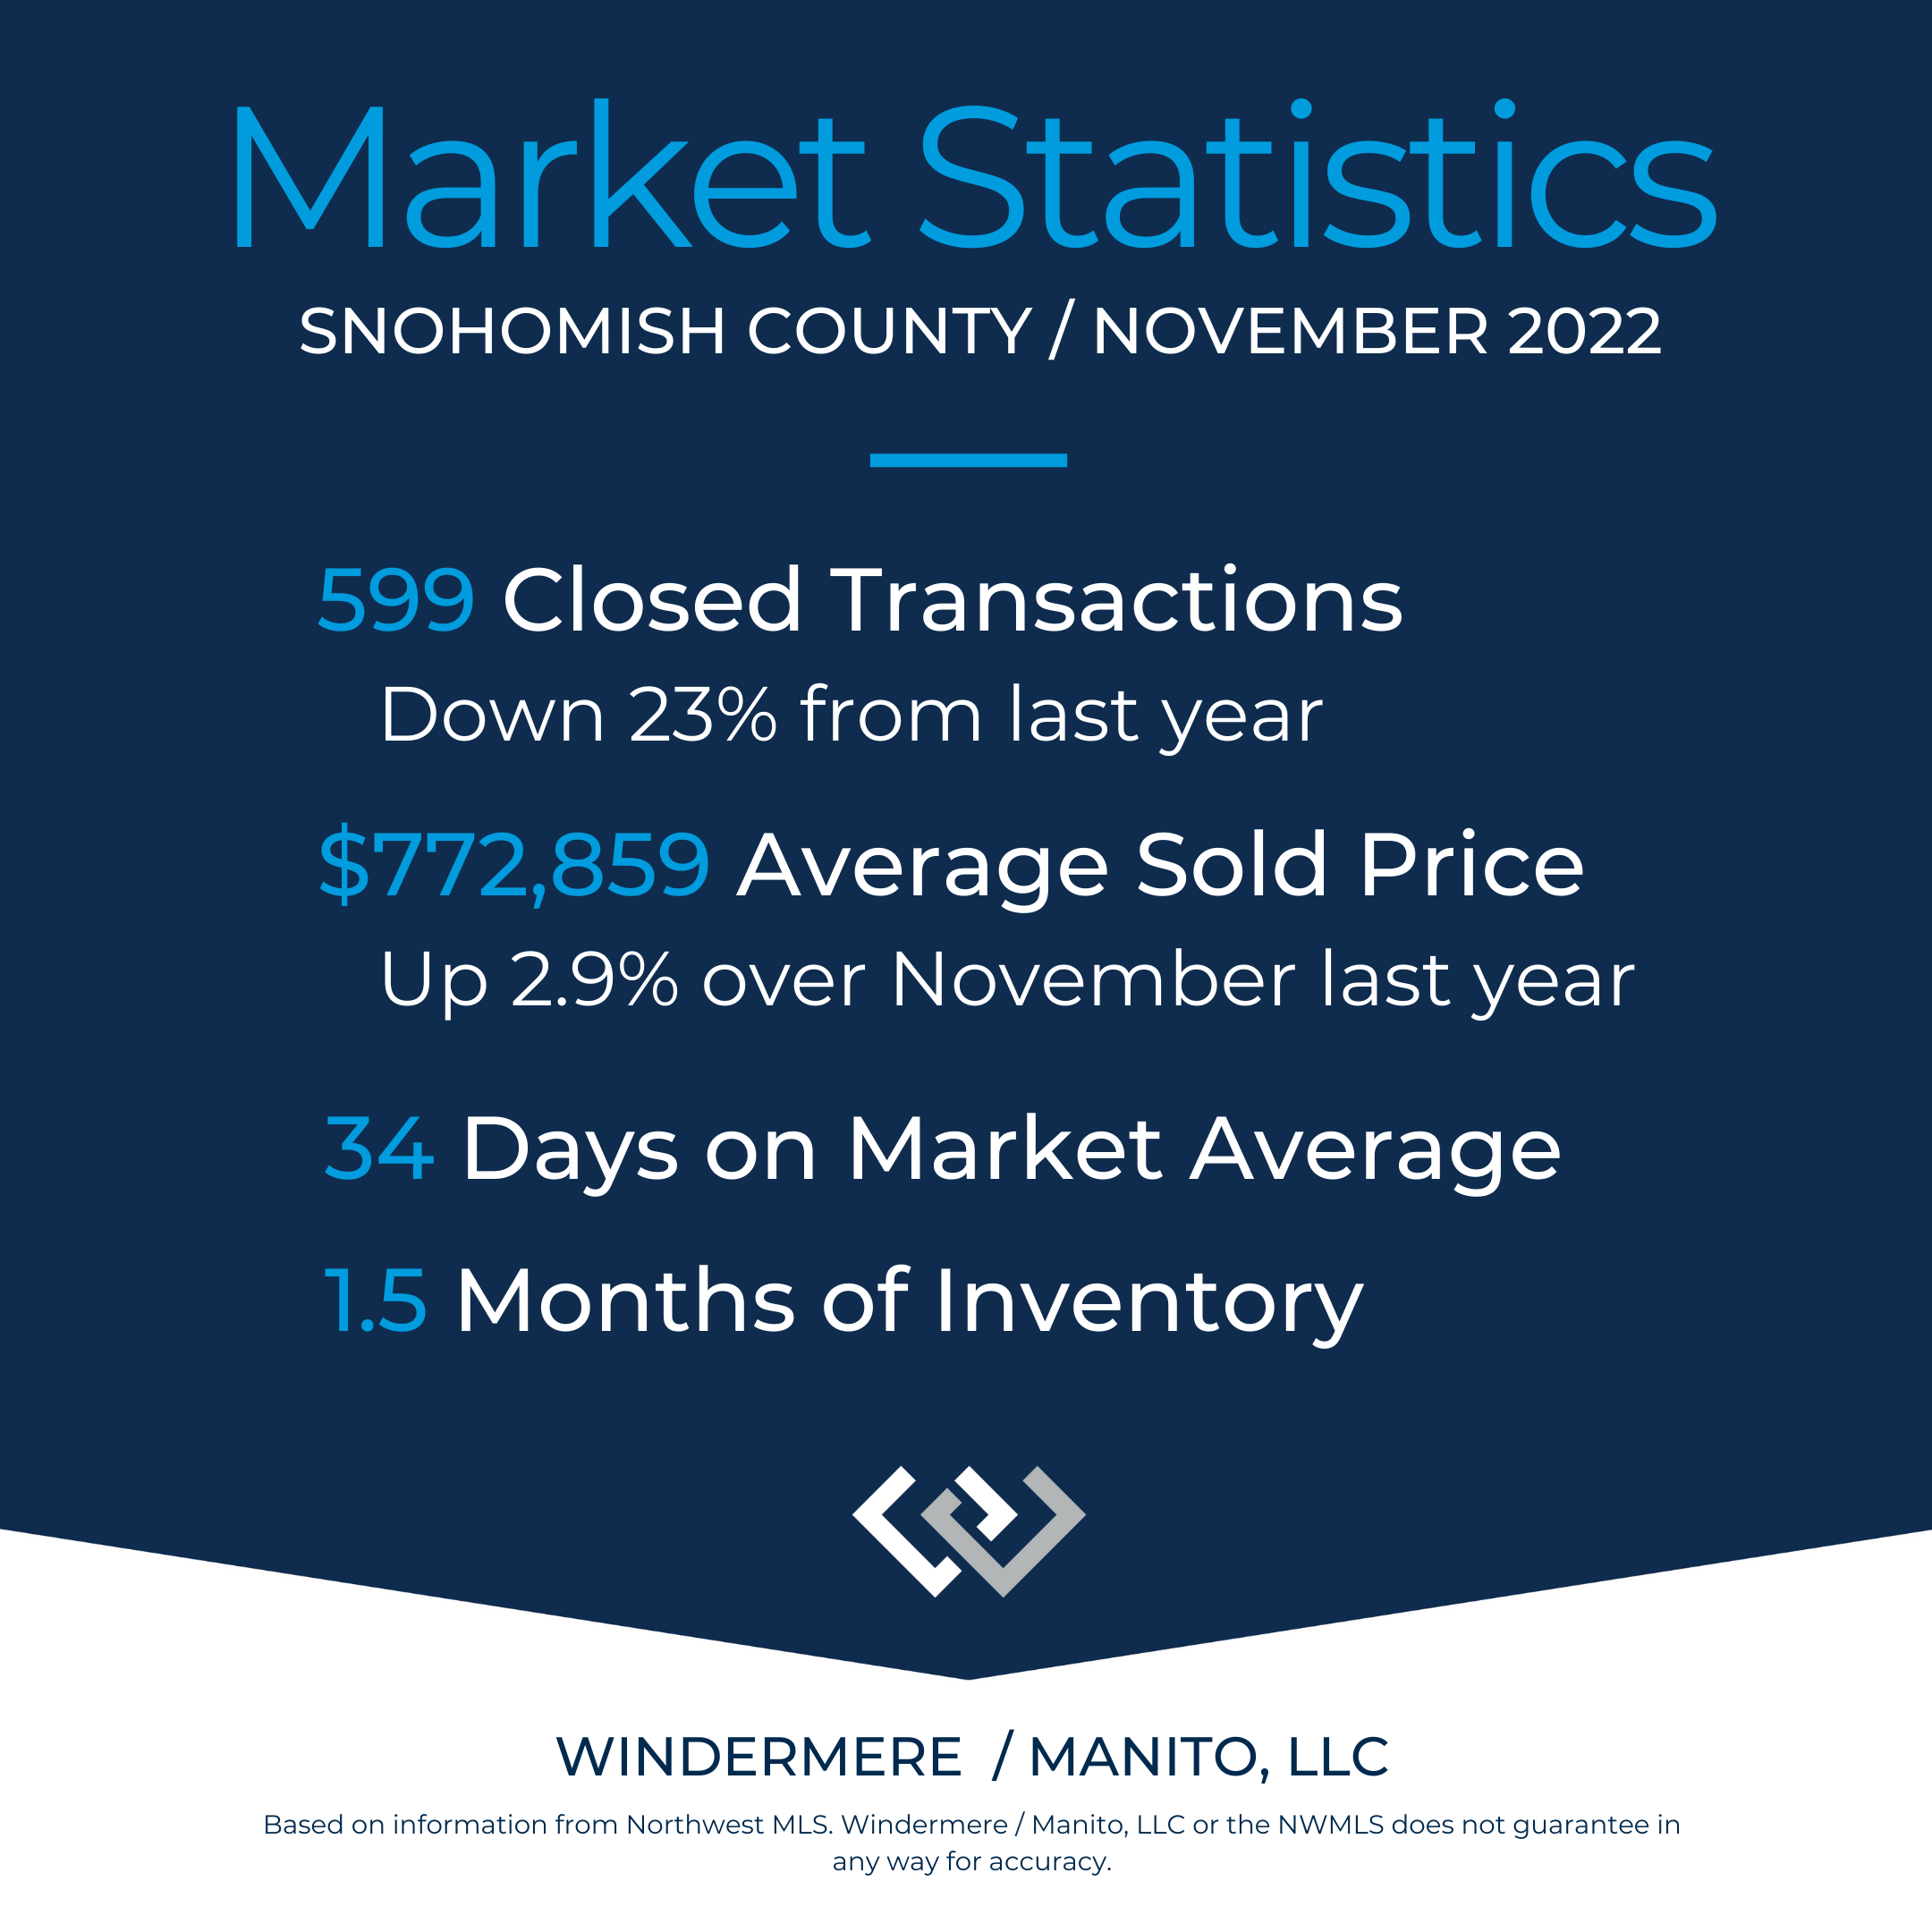
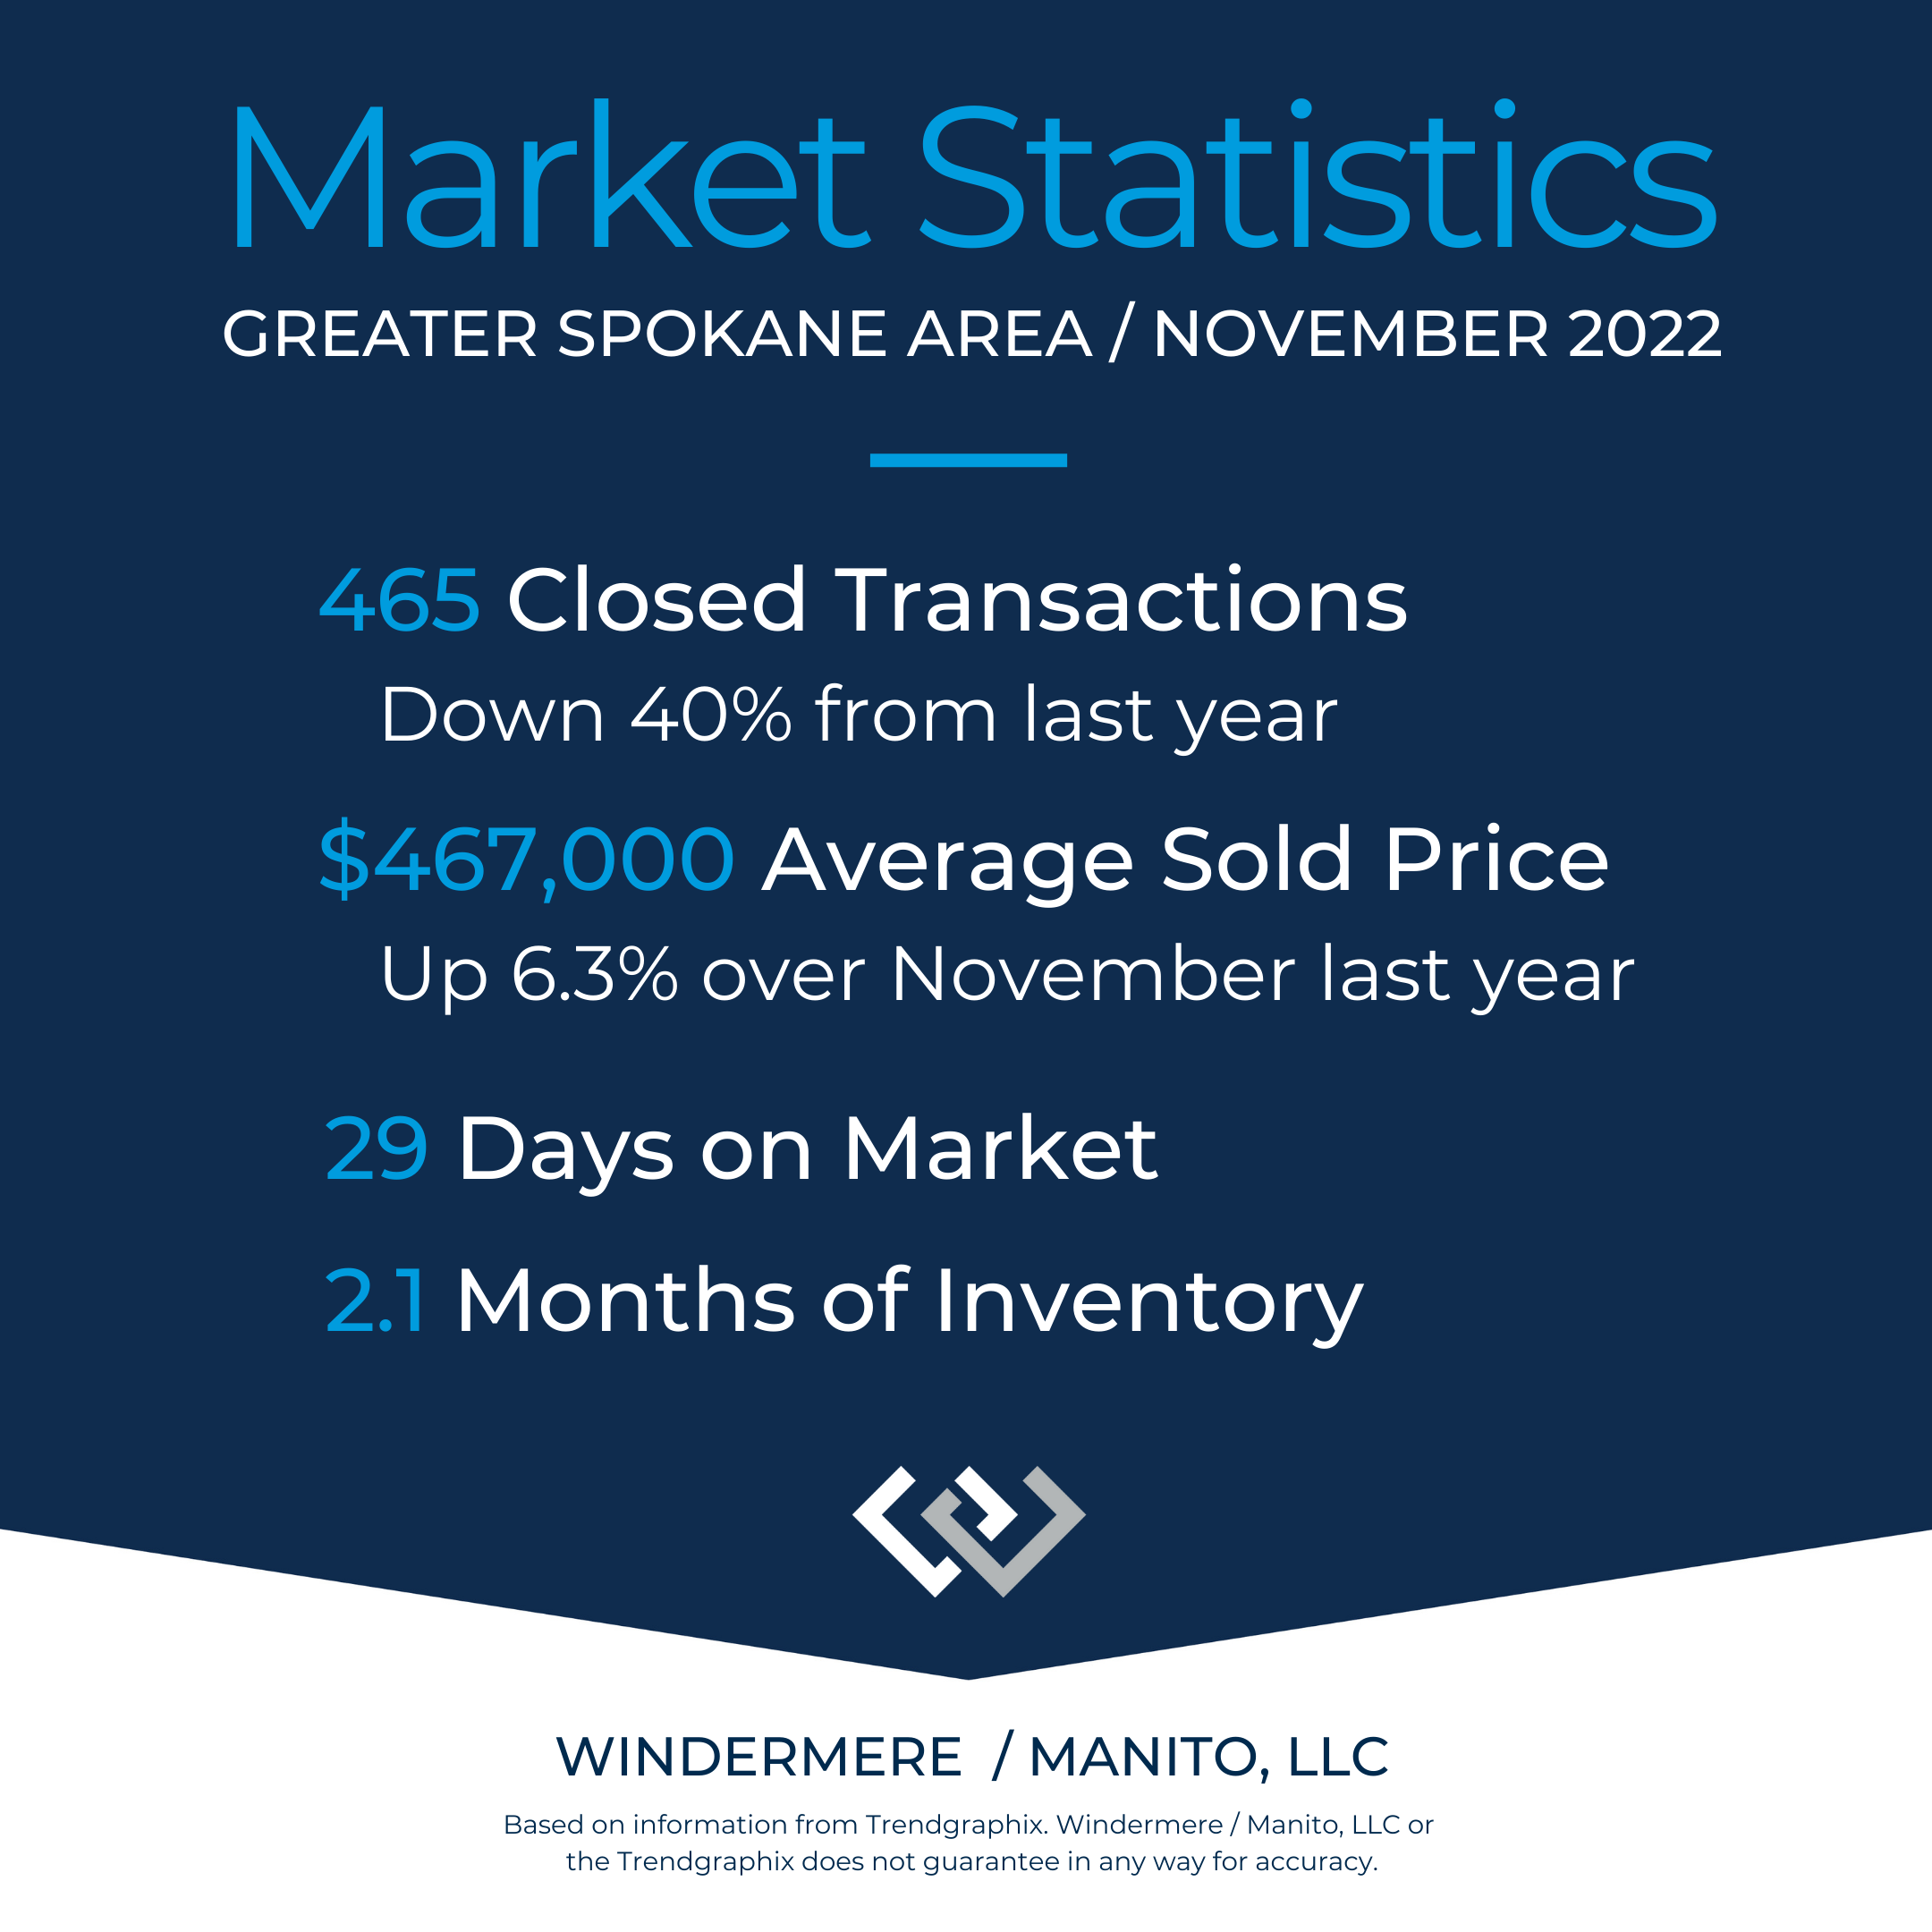
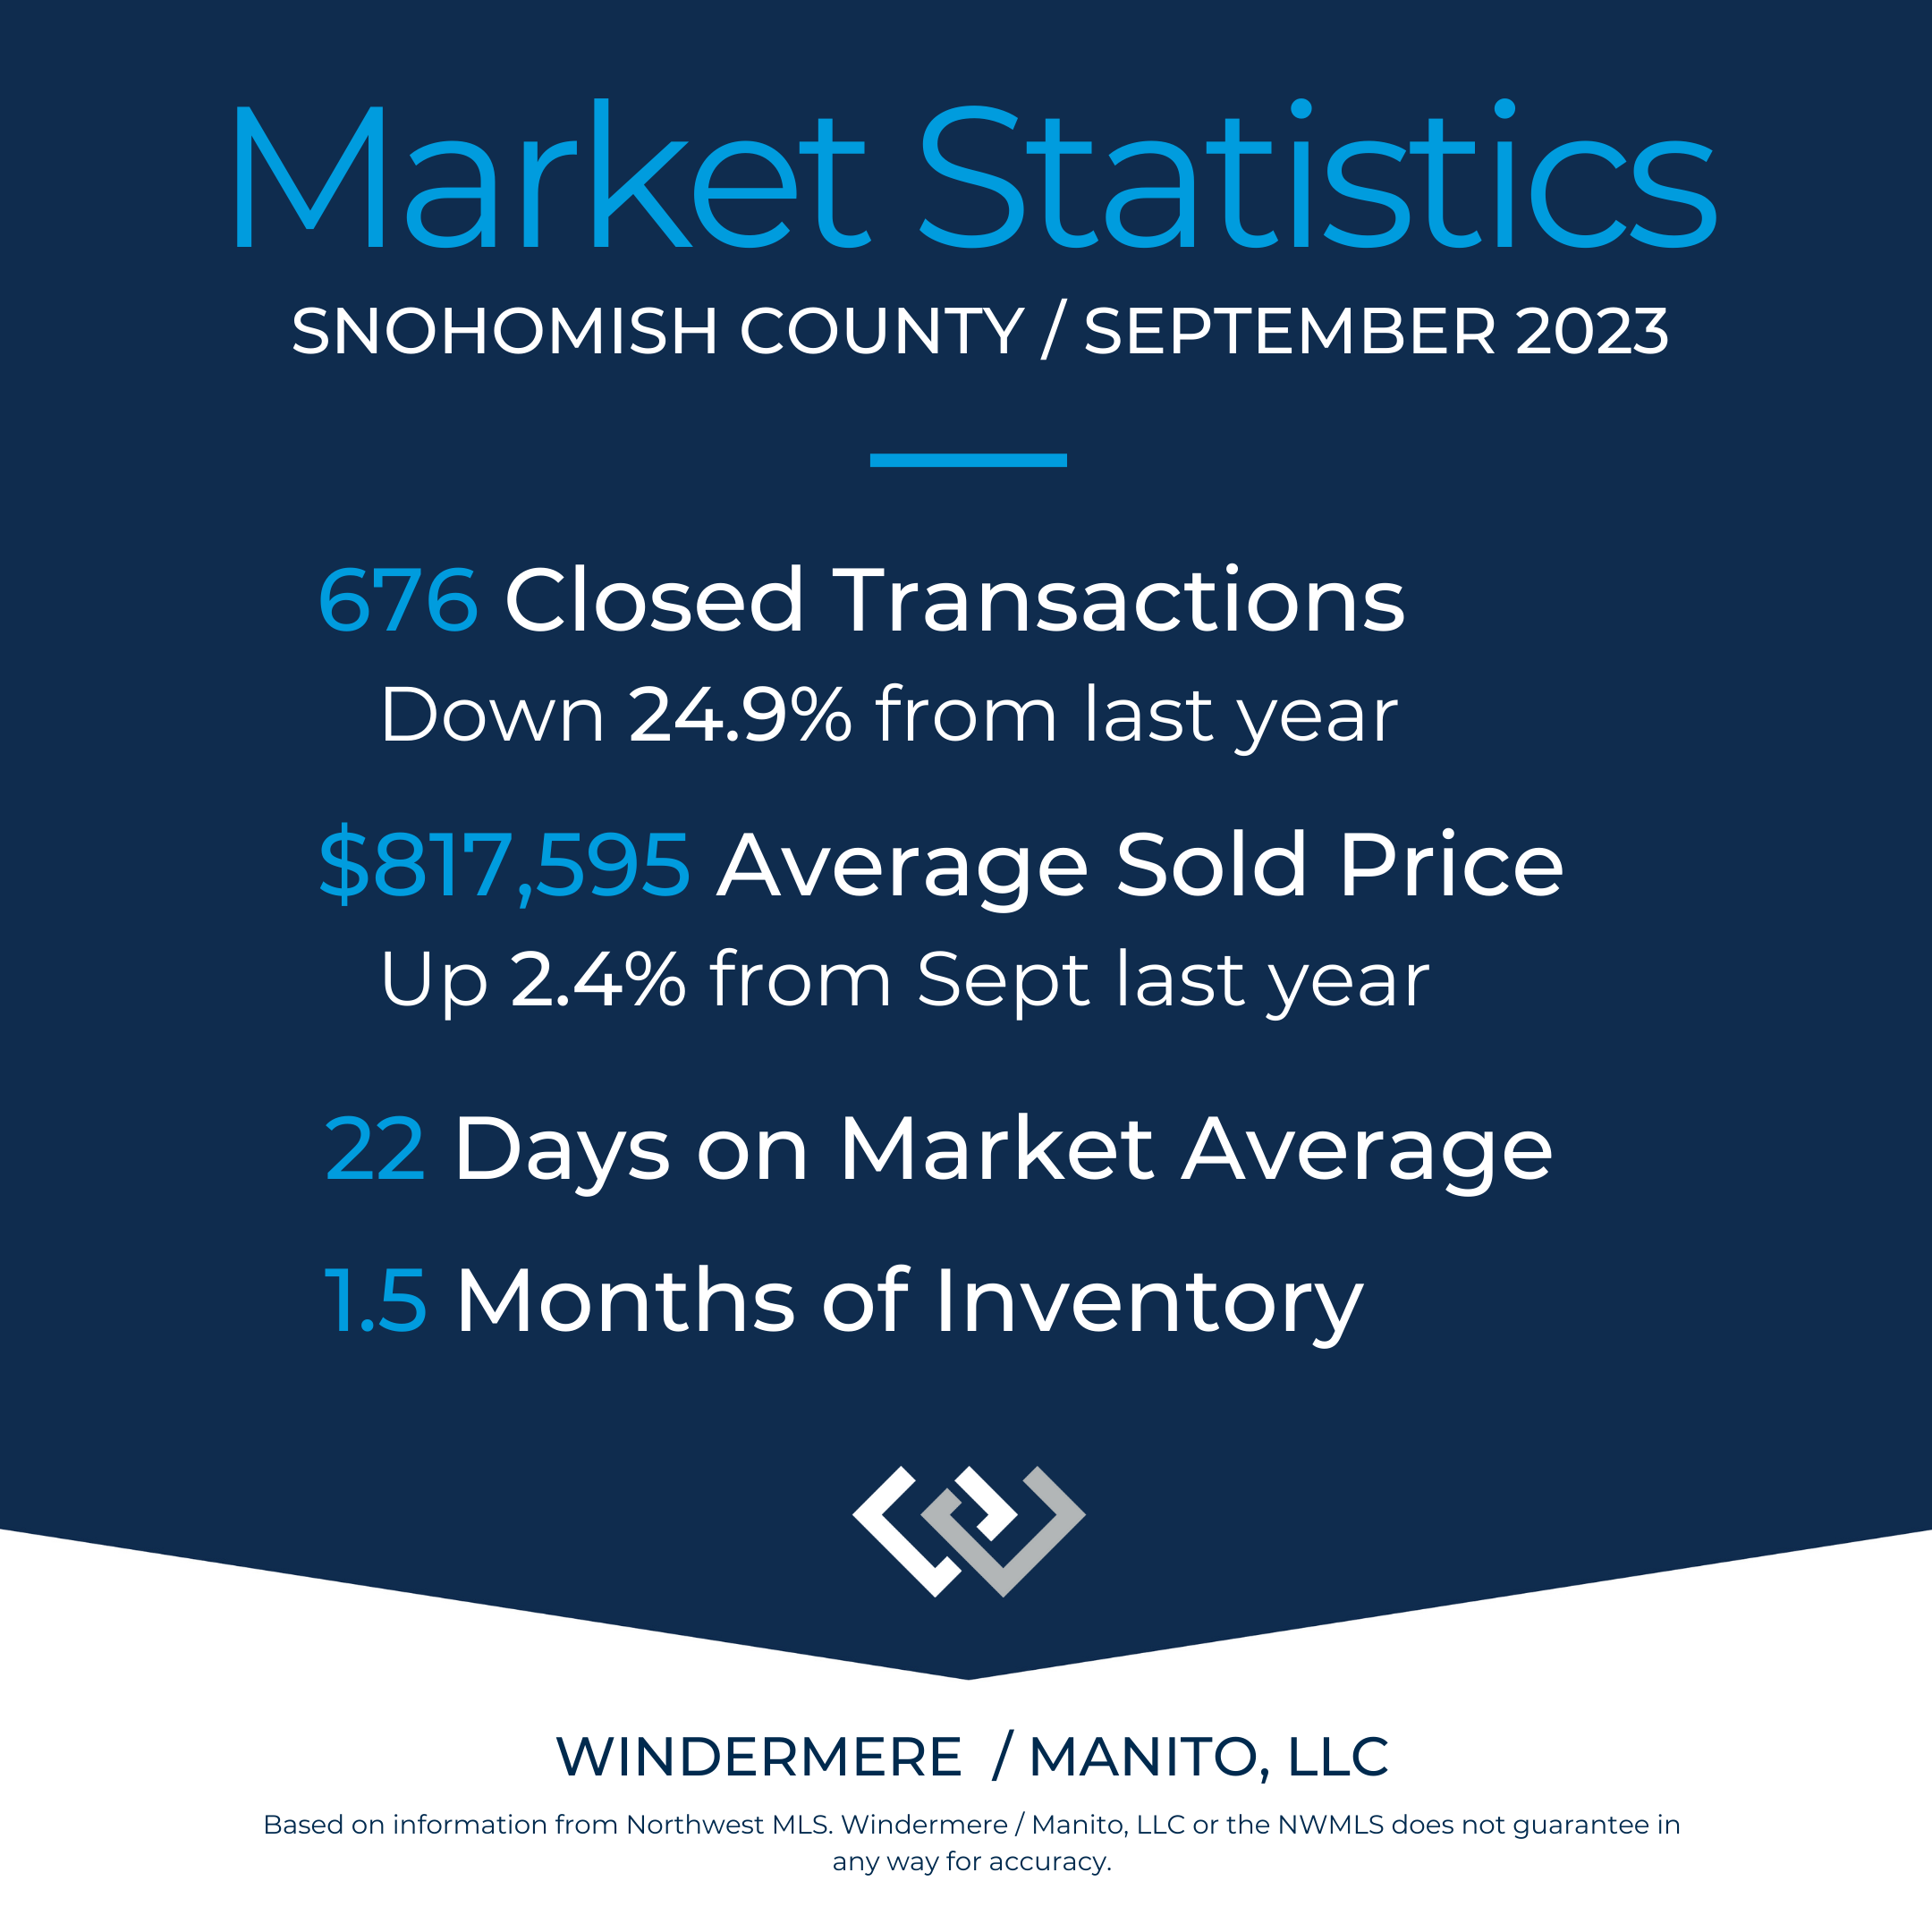
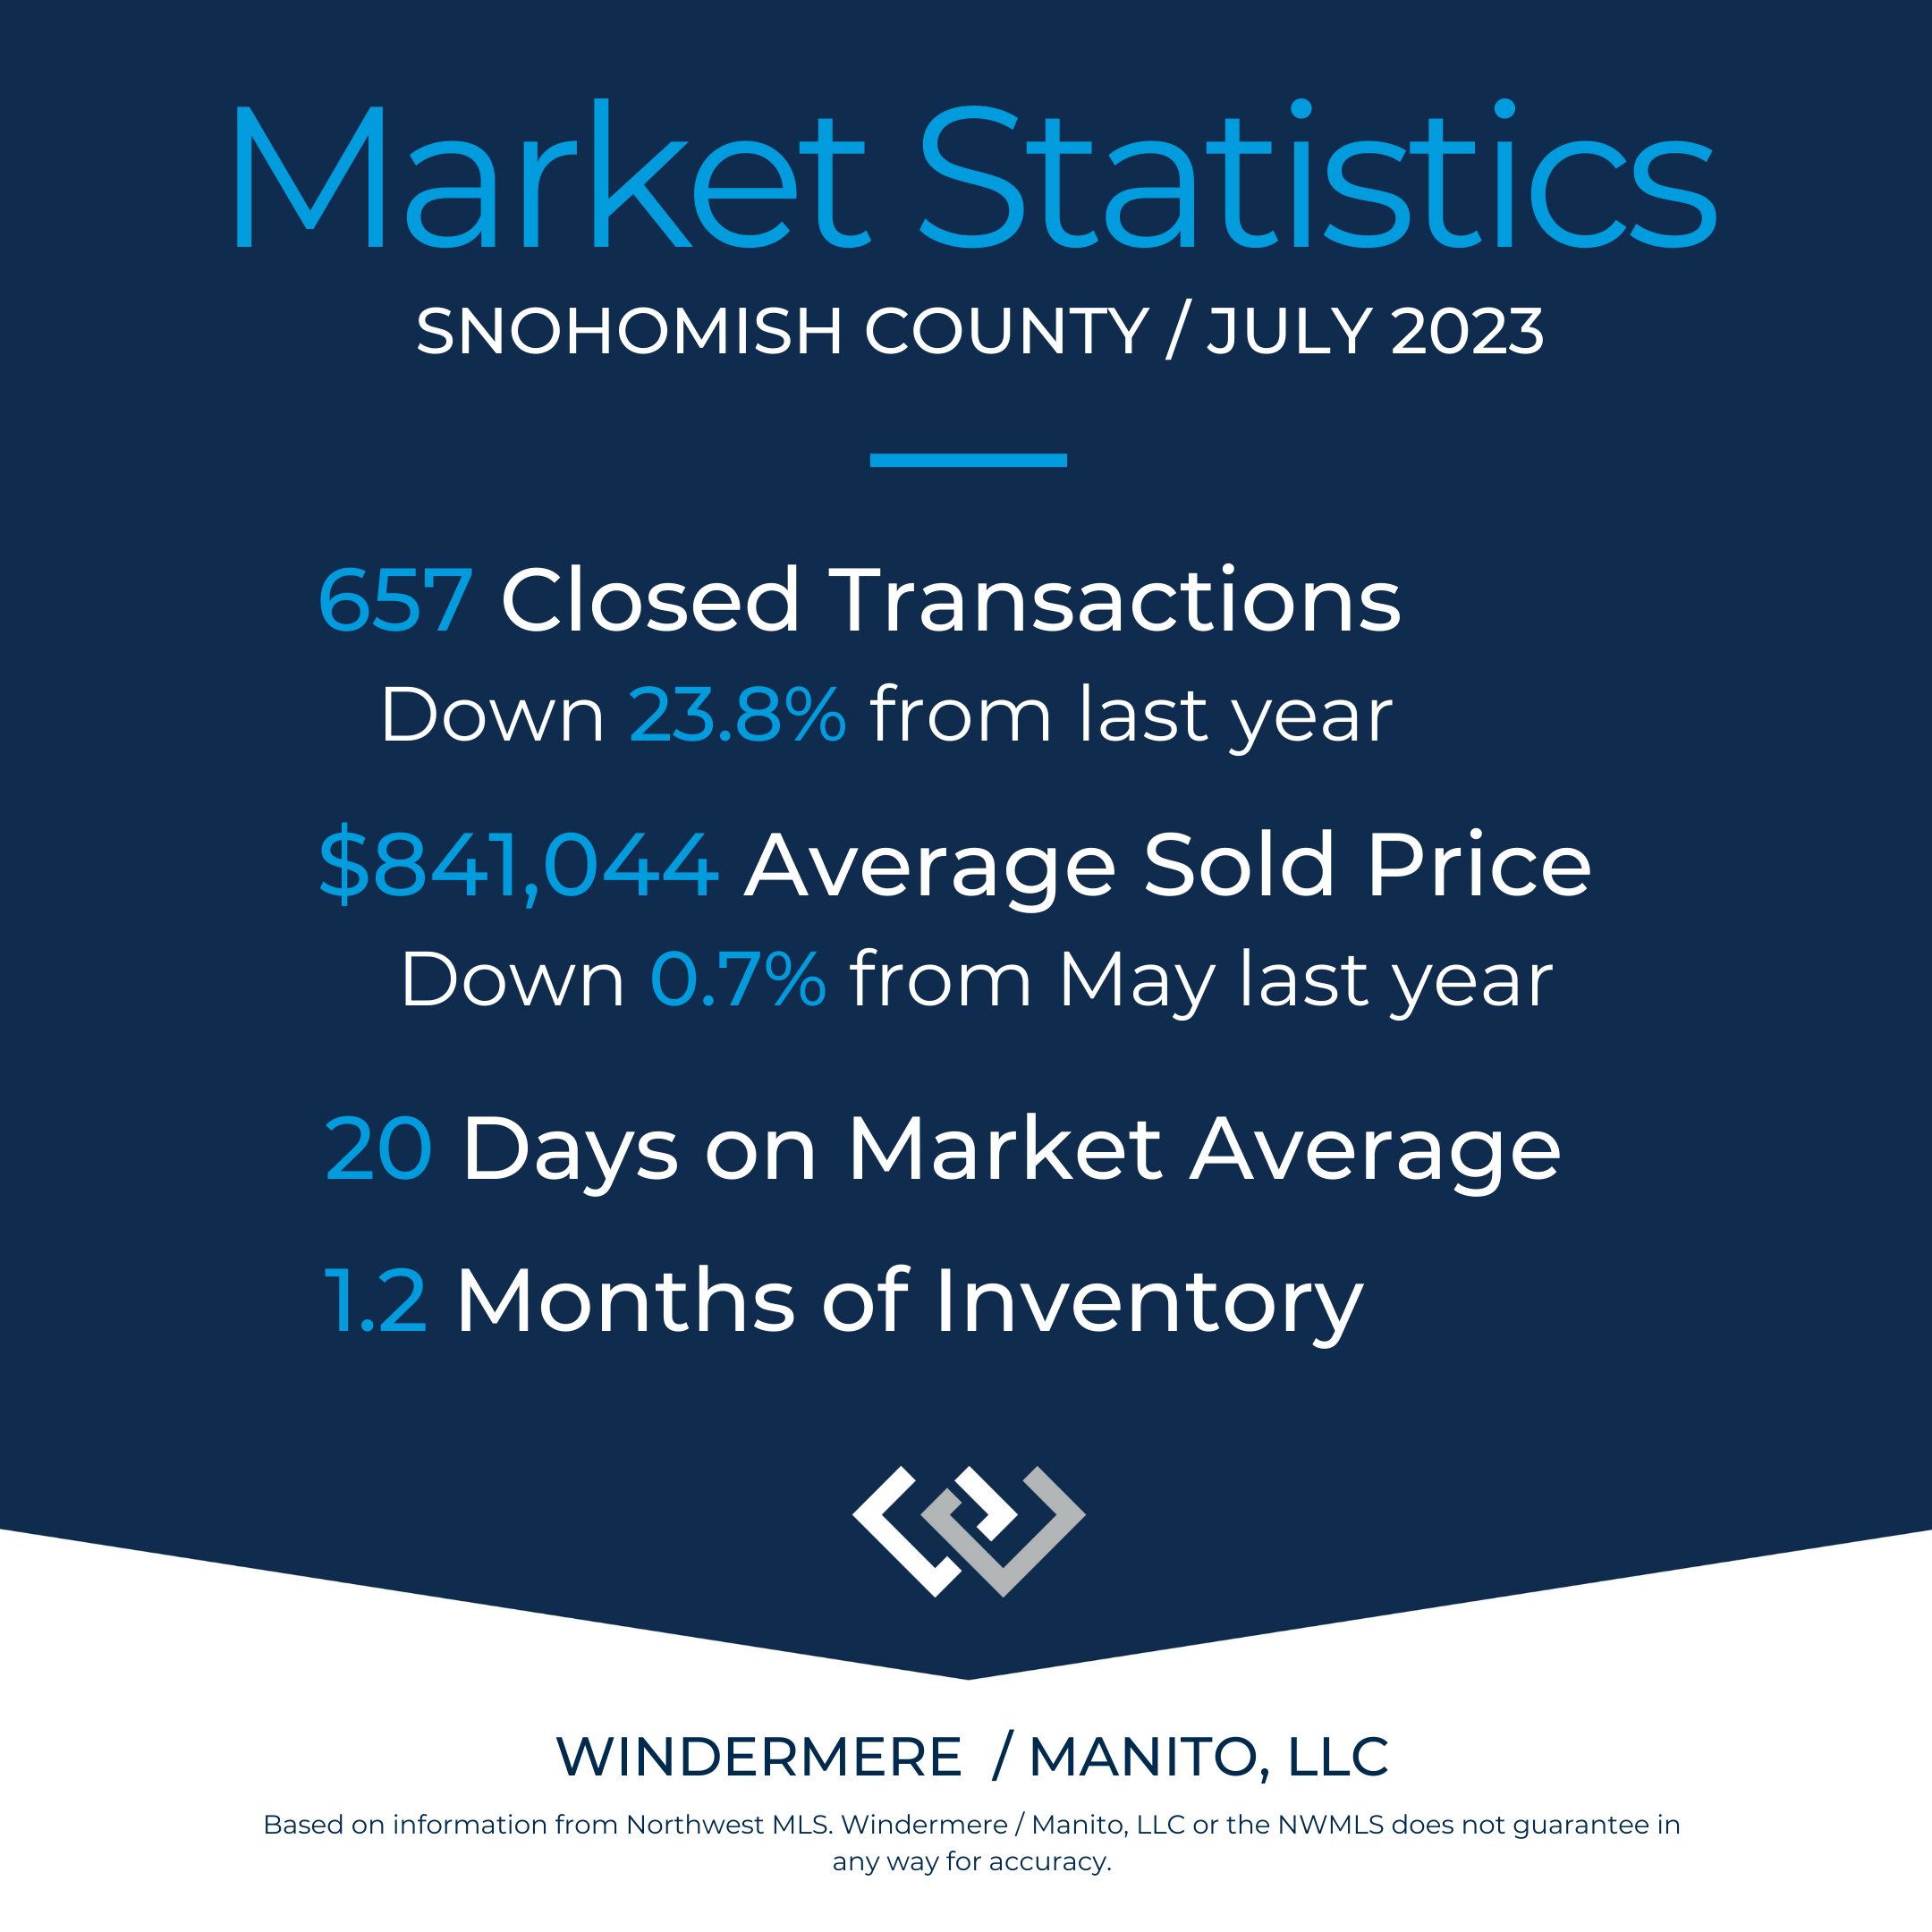
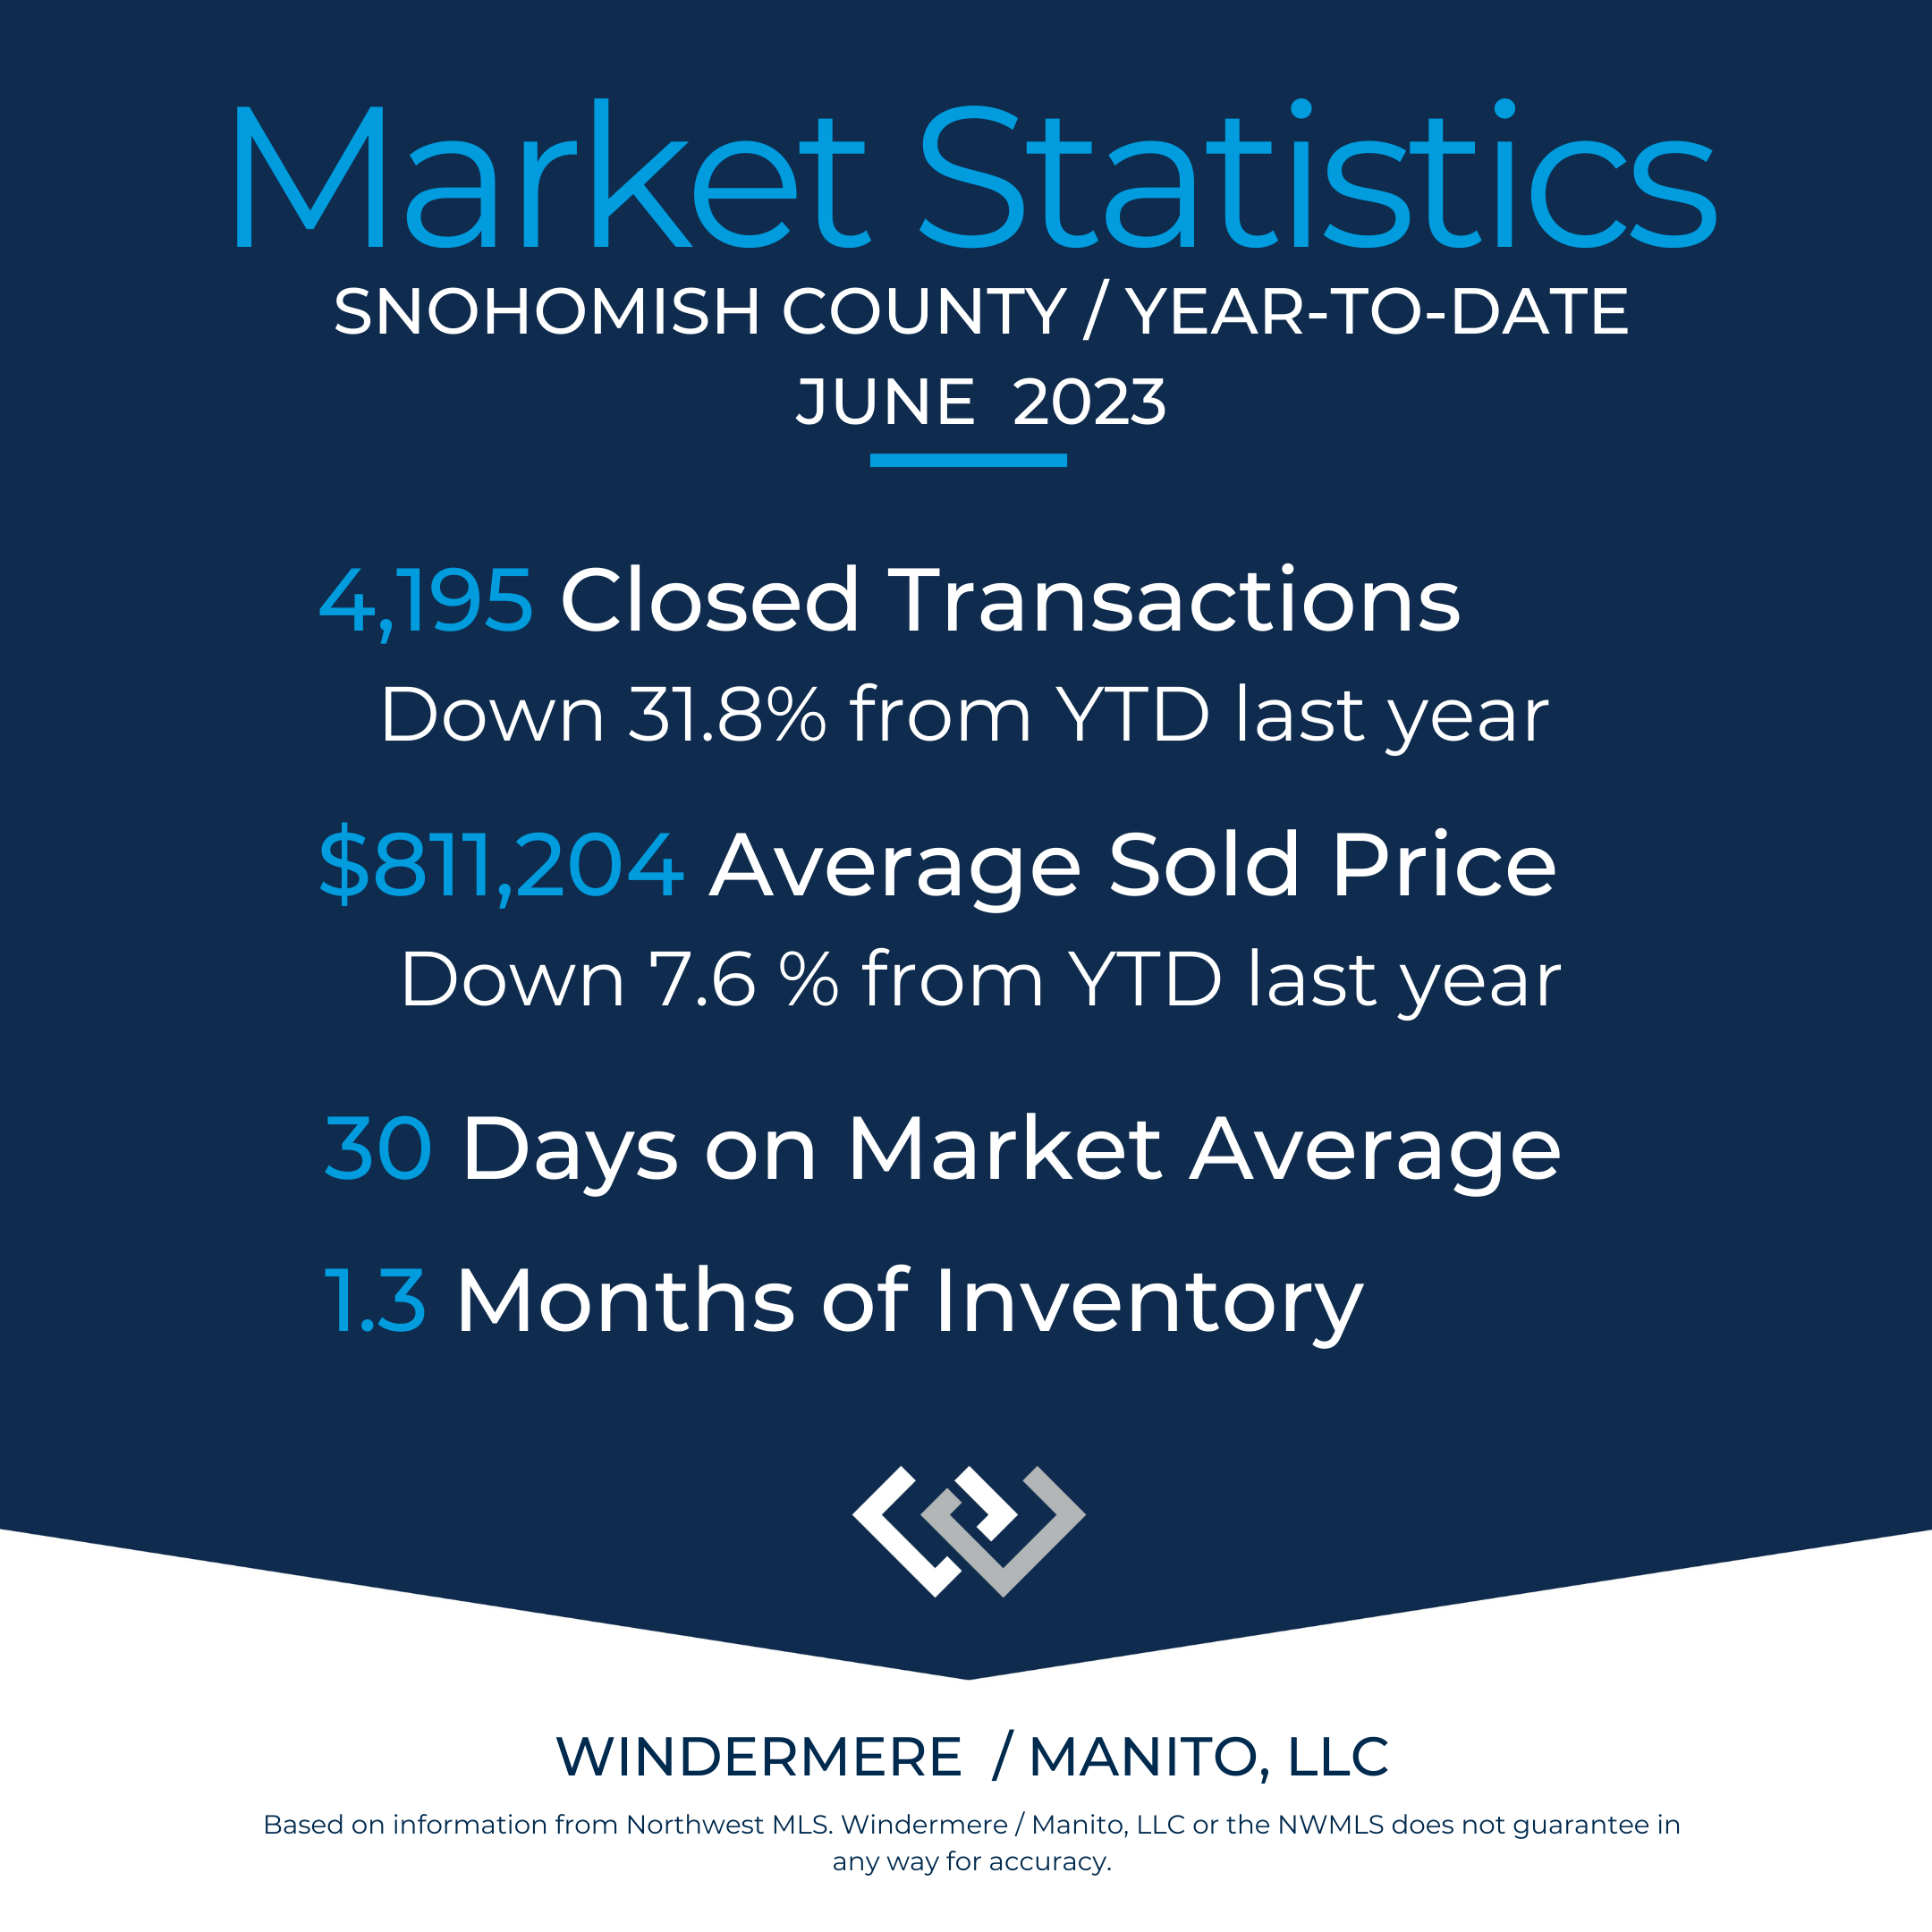
Snohomish County Market Observations
You know well, we are seeing a bit of shifting in the market in Snohomish County, like the Spokane area. Looking at both sets of stats - you can see that the markets are almost like echoes. And, of course, each neighborhood can vary from another with-in the larger market.
My role with clients is to educate and paint the big picture with data, stories, and solid listening.
This market shift means different things depending on your role. Are you a buyer? Are you a seller? Let's chat - I'll help you interpret what this market offers you if you considering buying or selling a home.
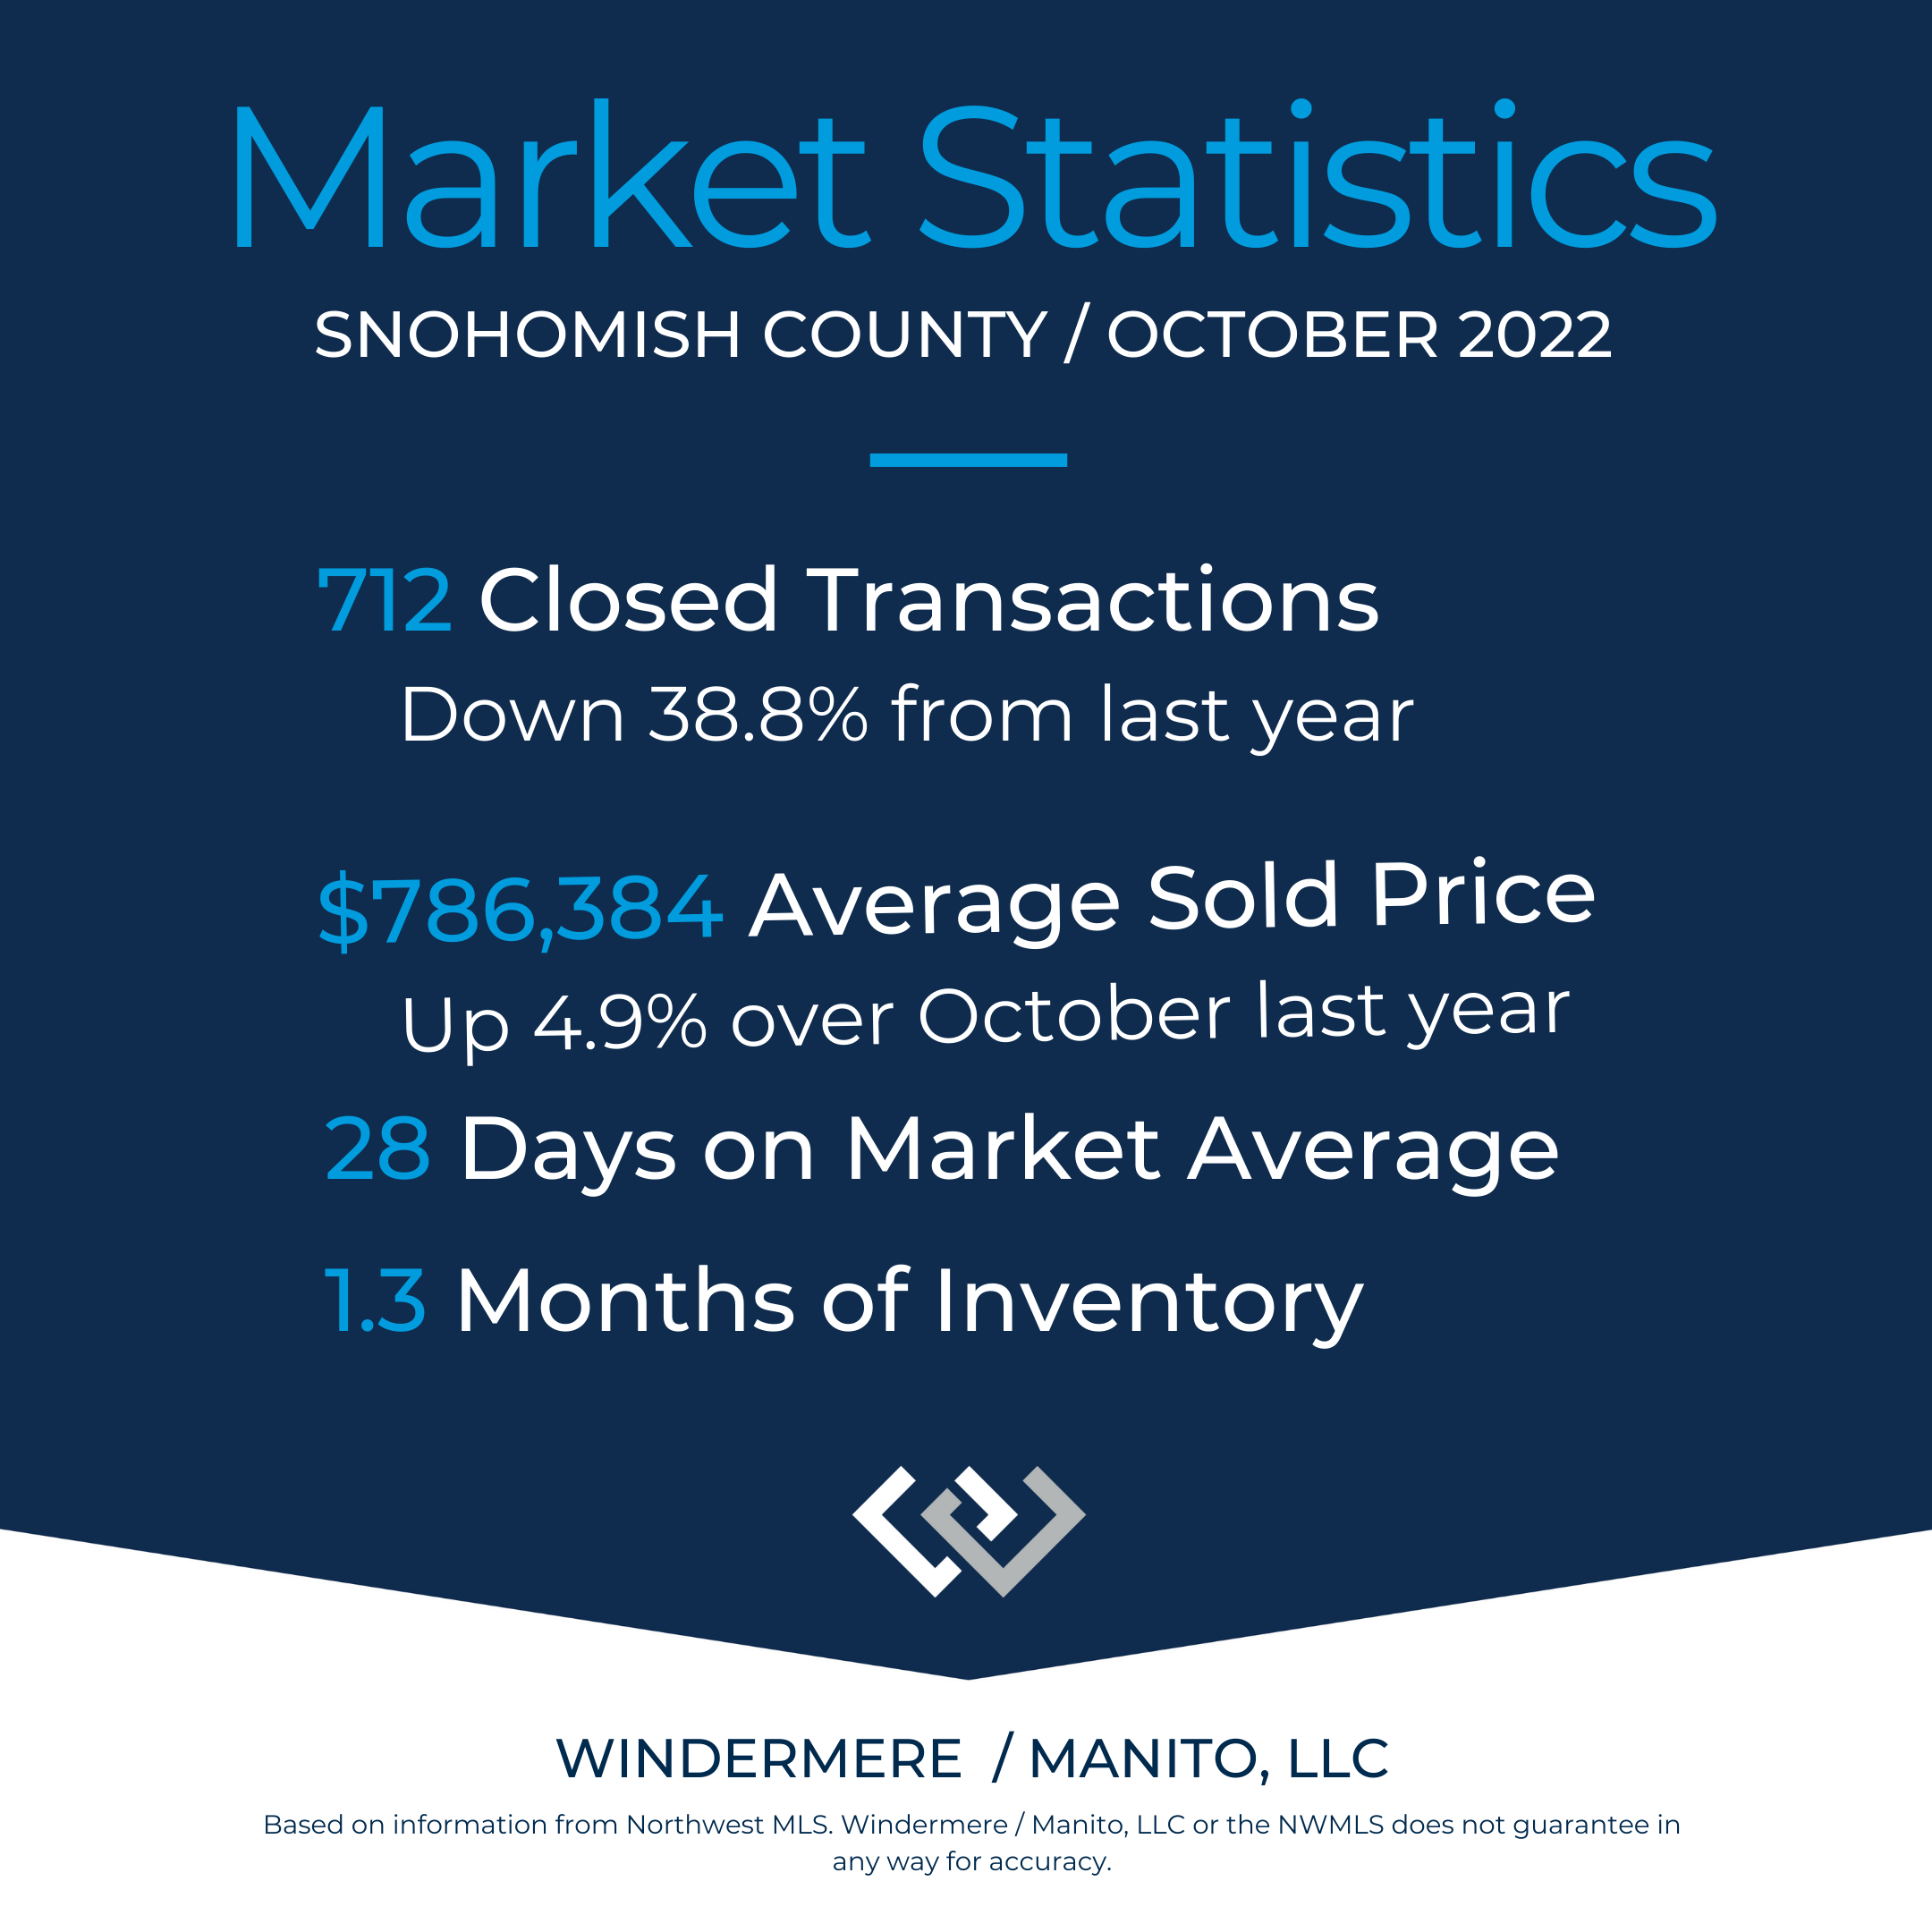
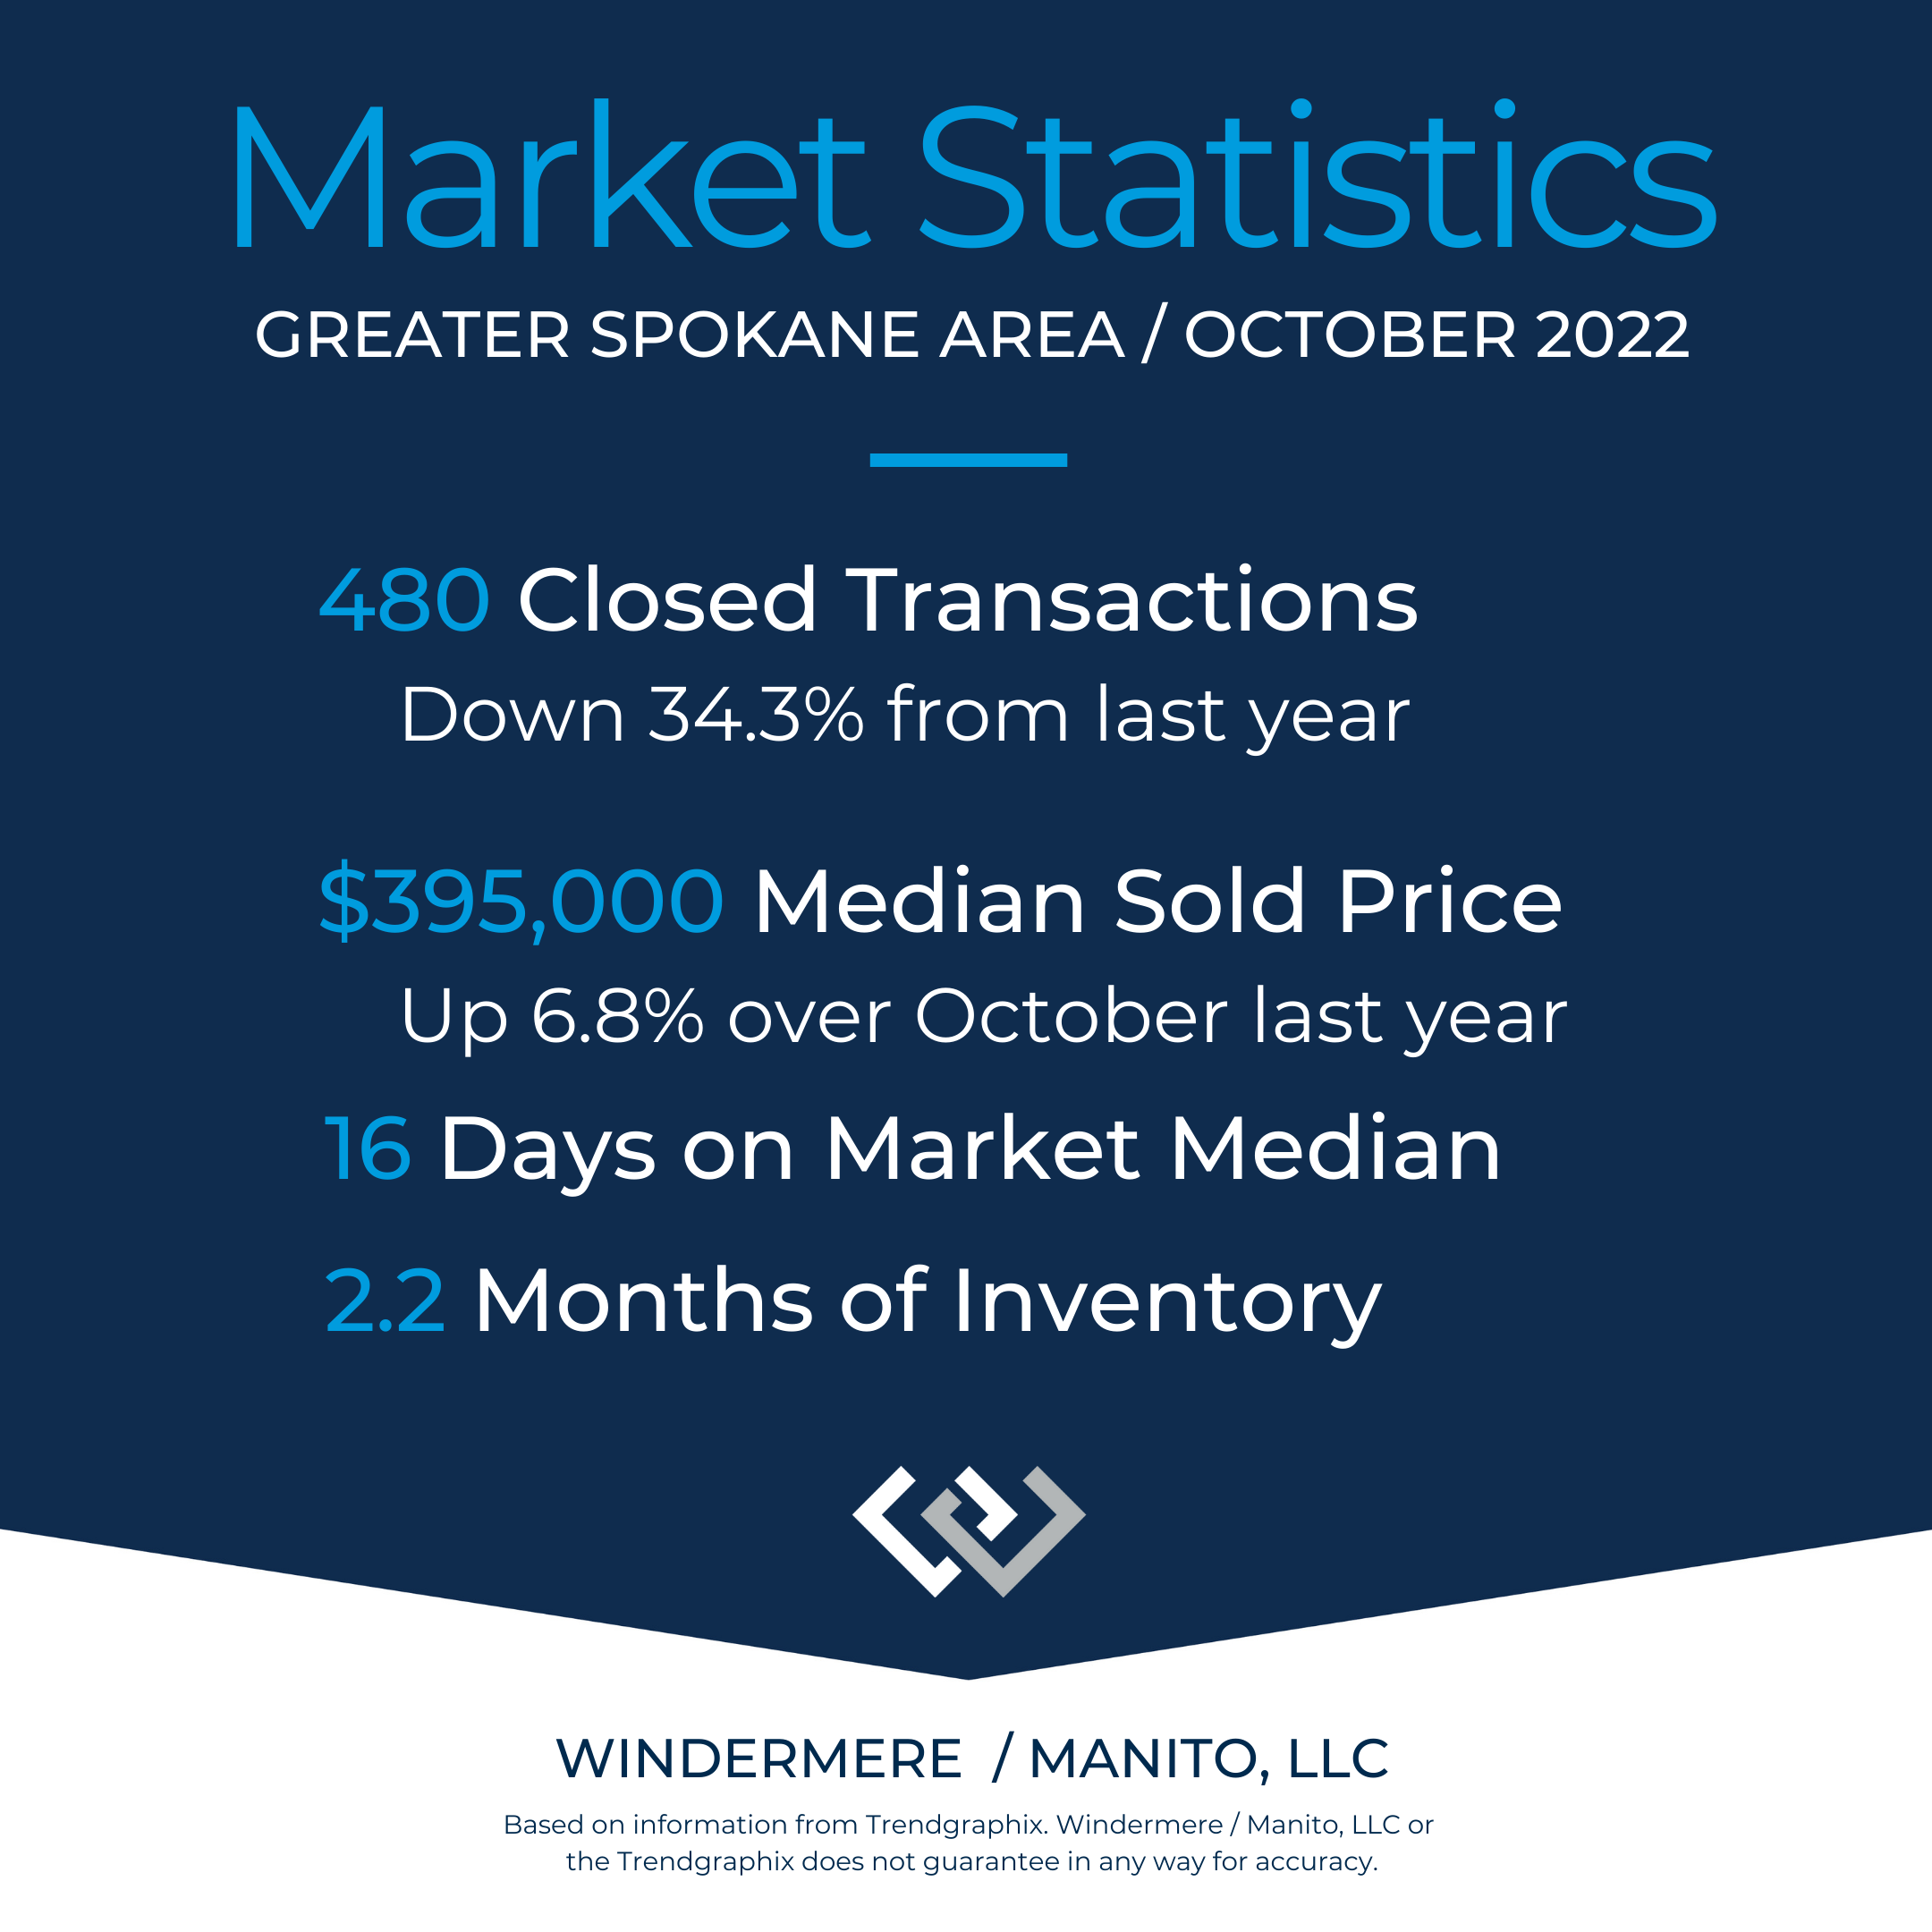
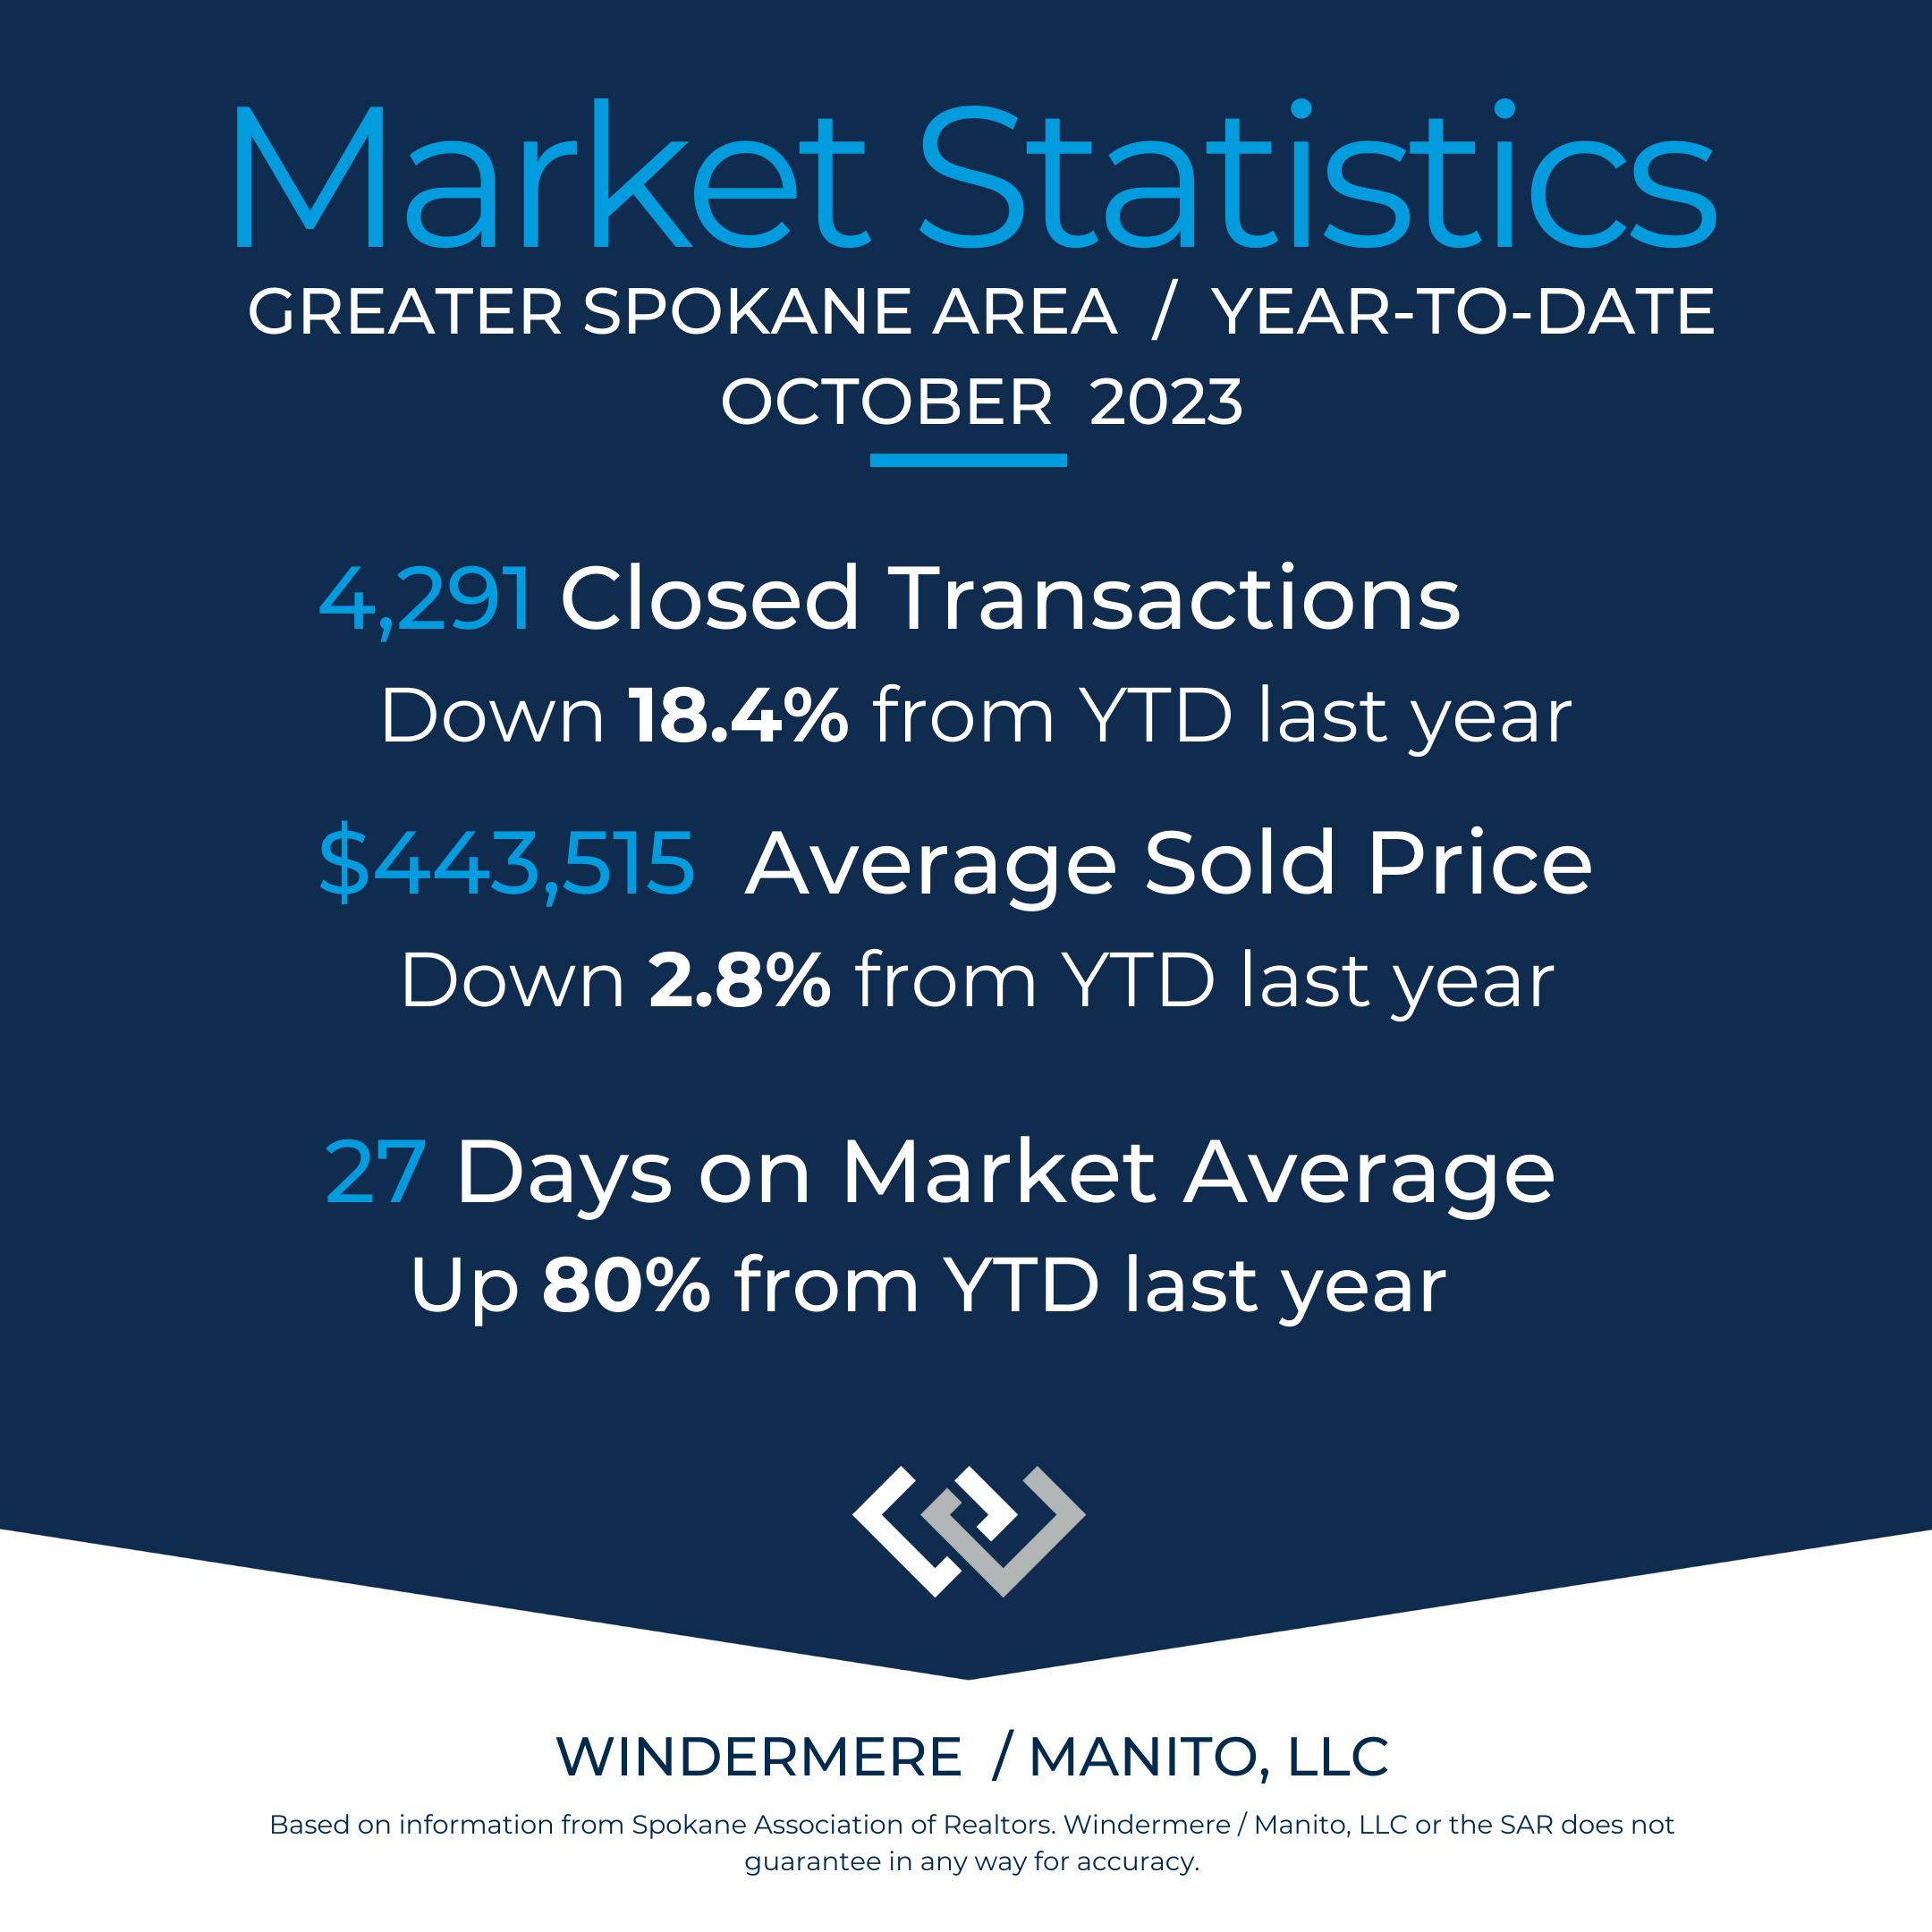
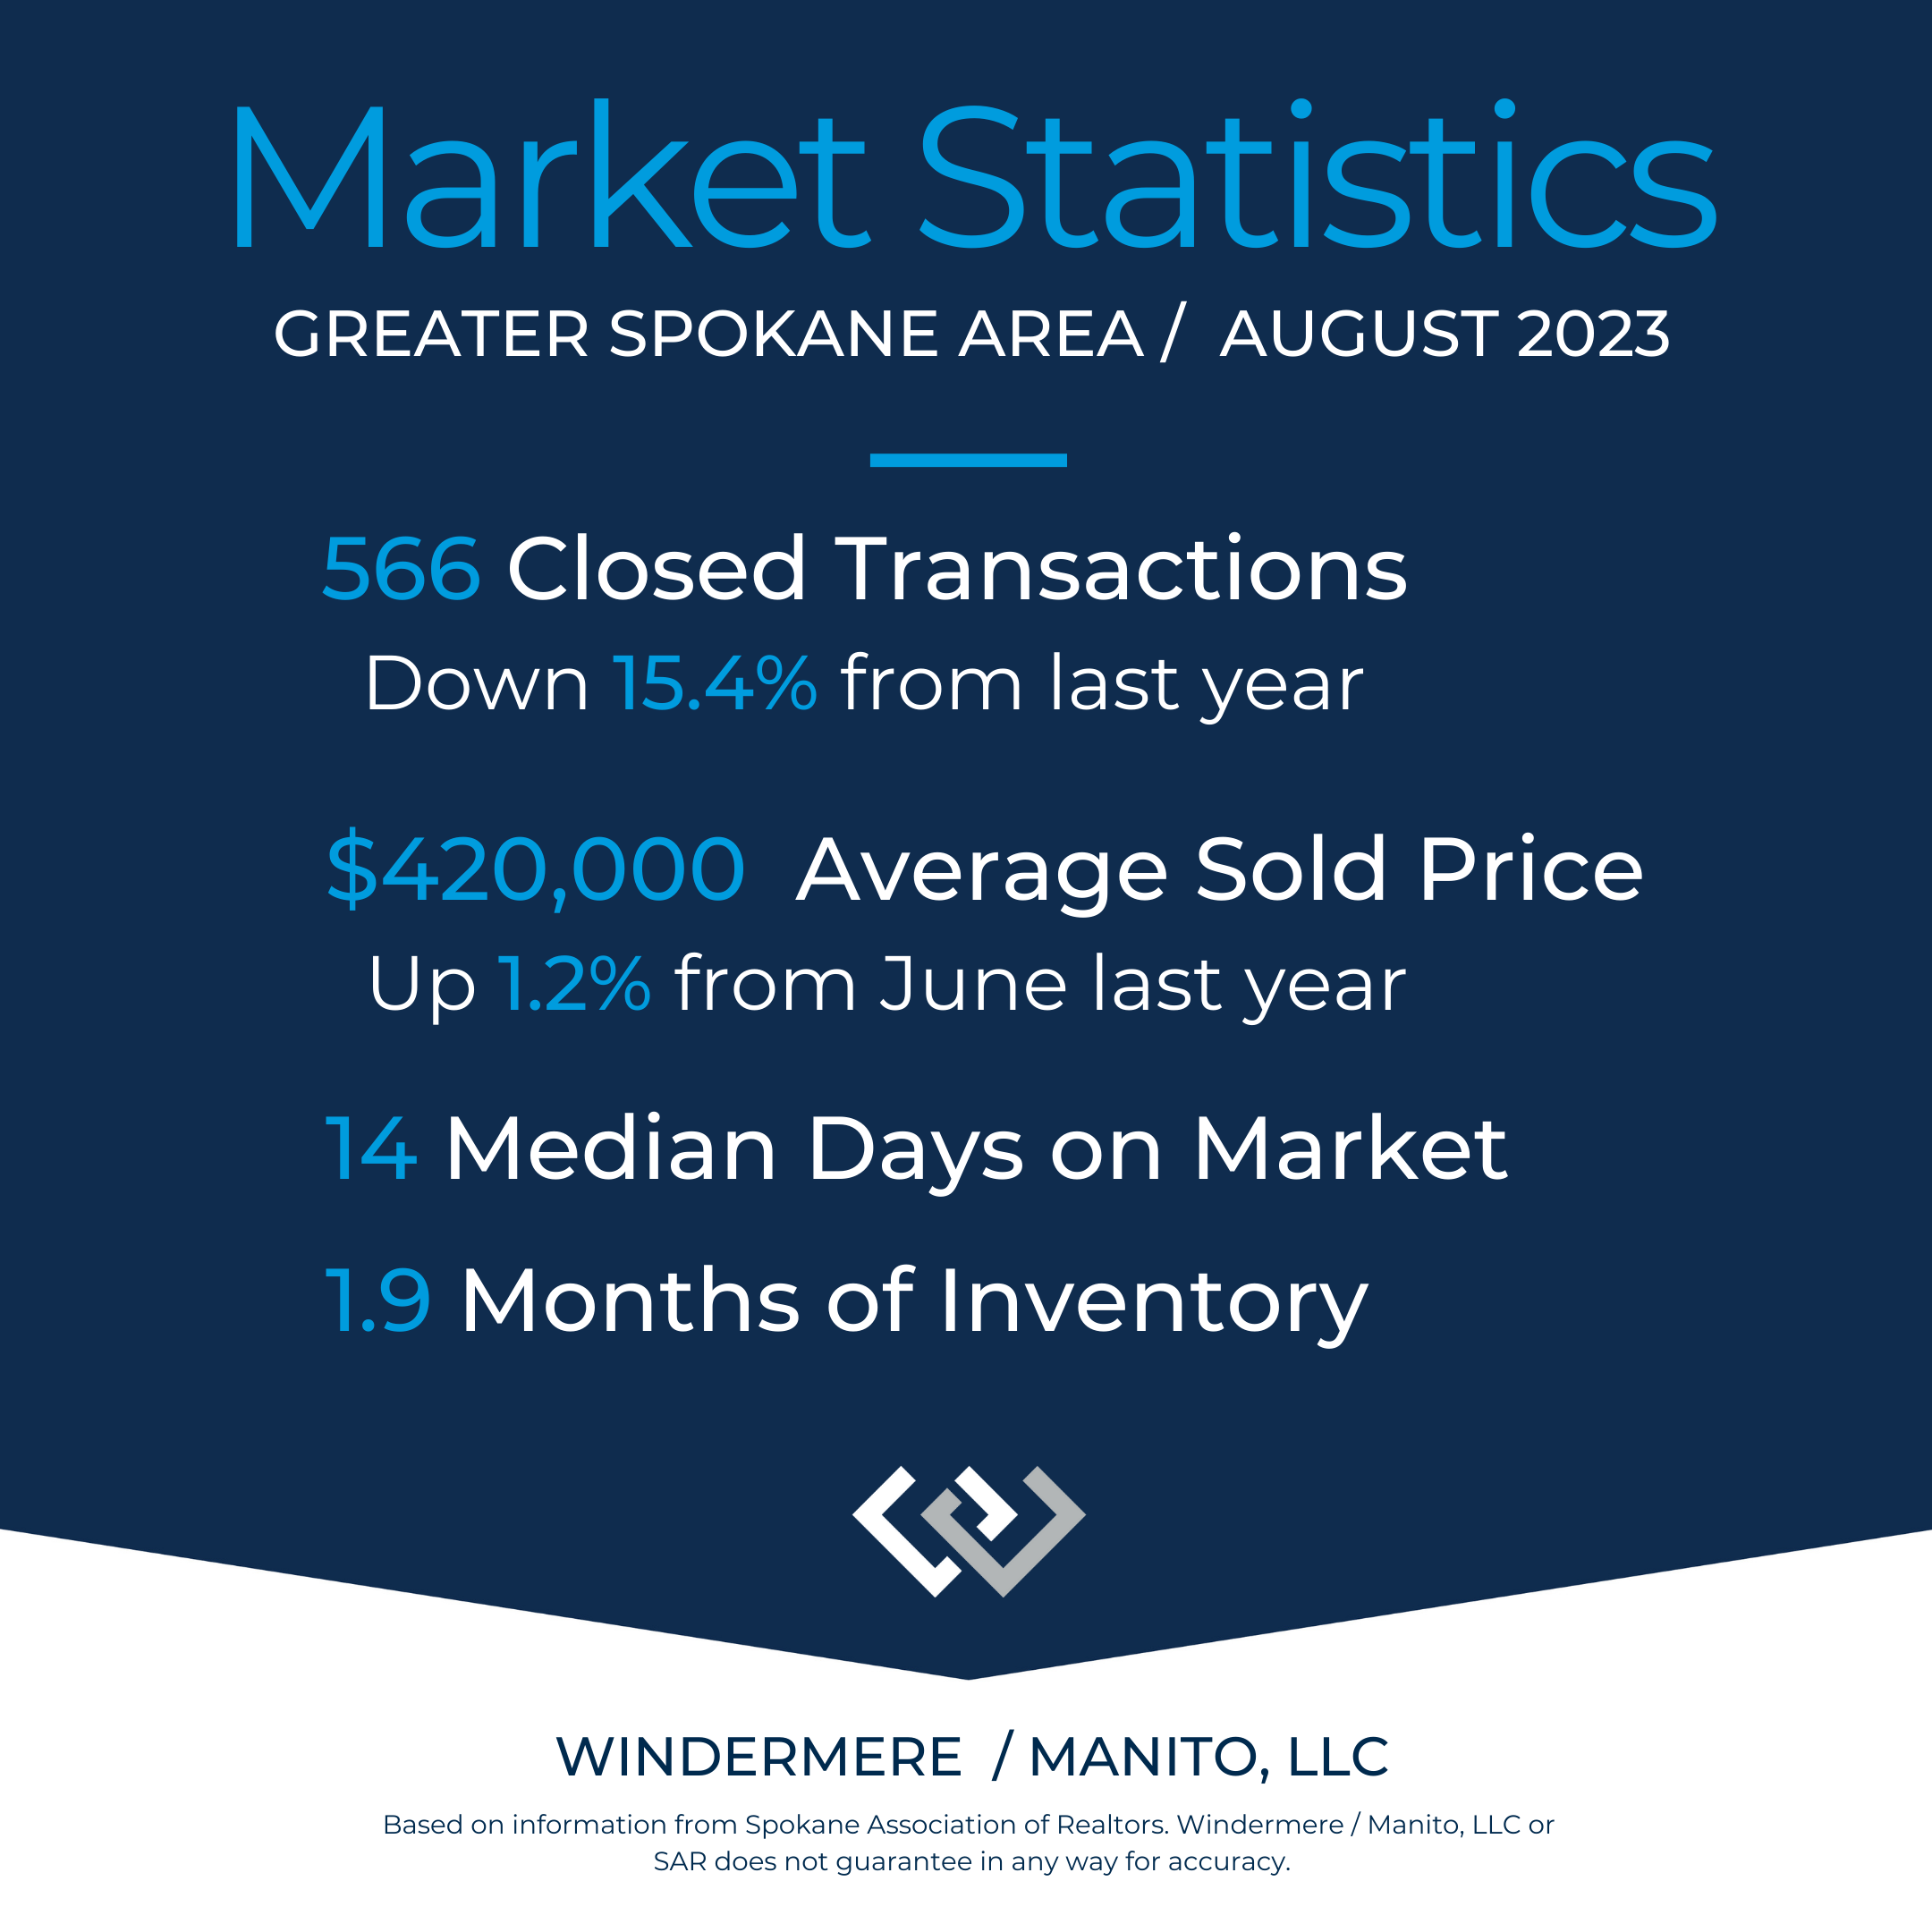
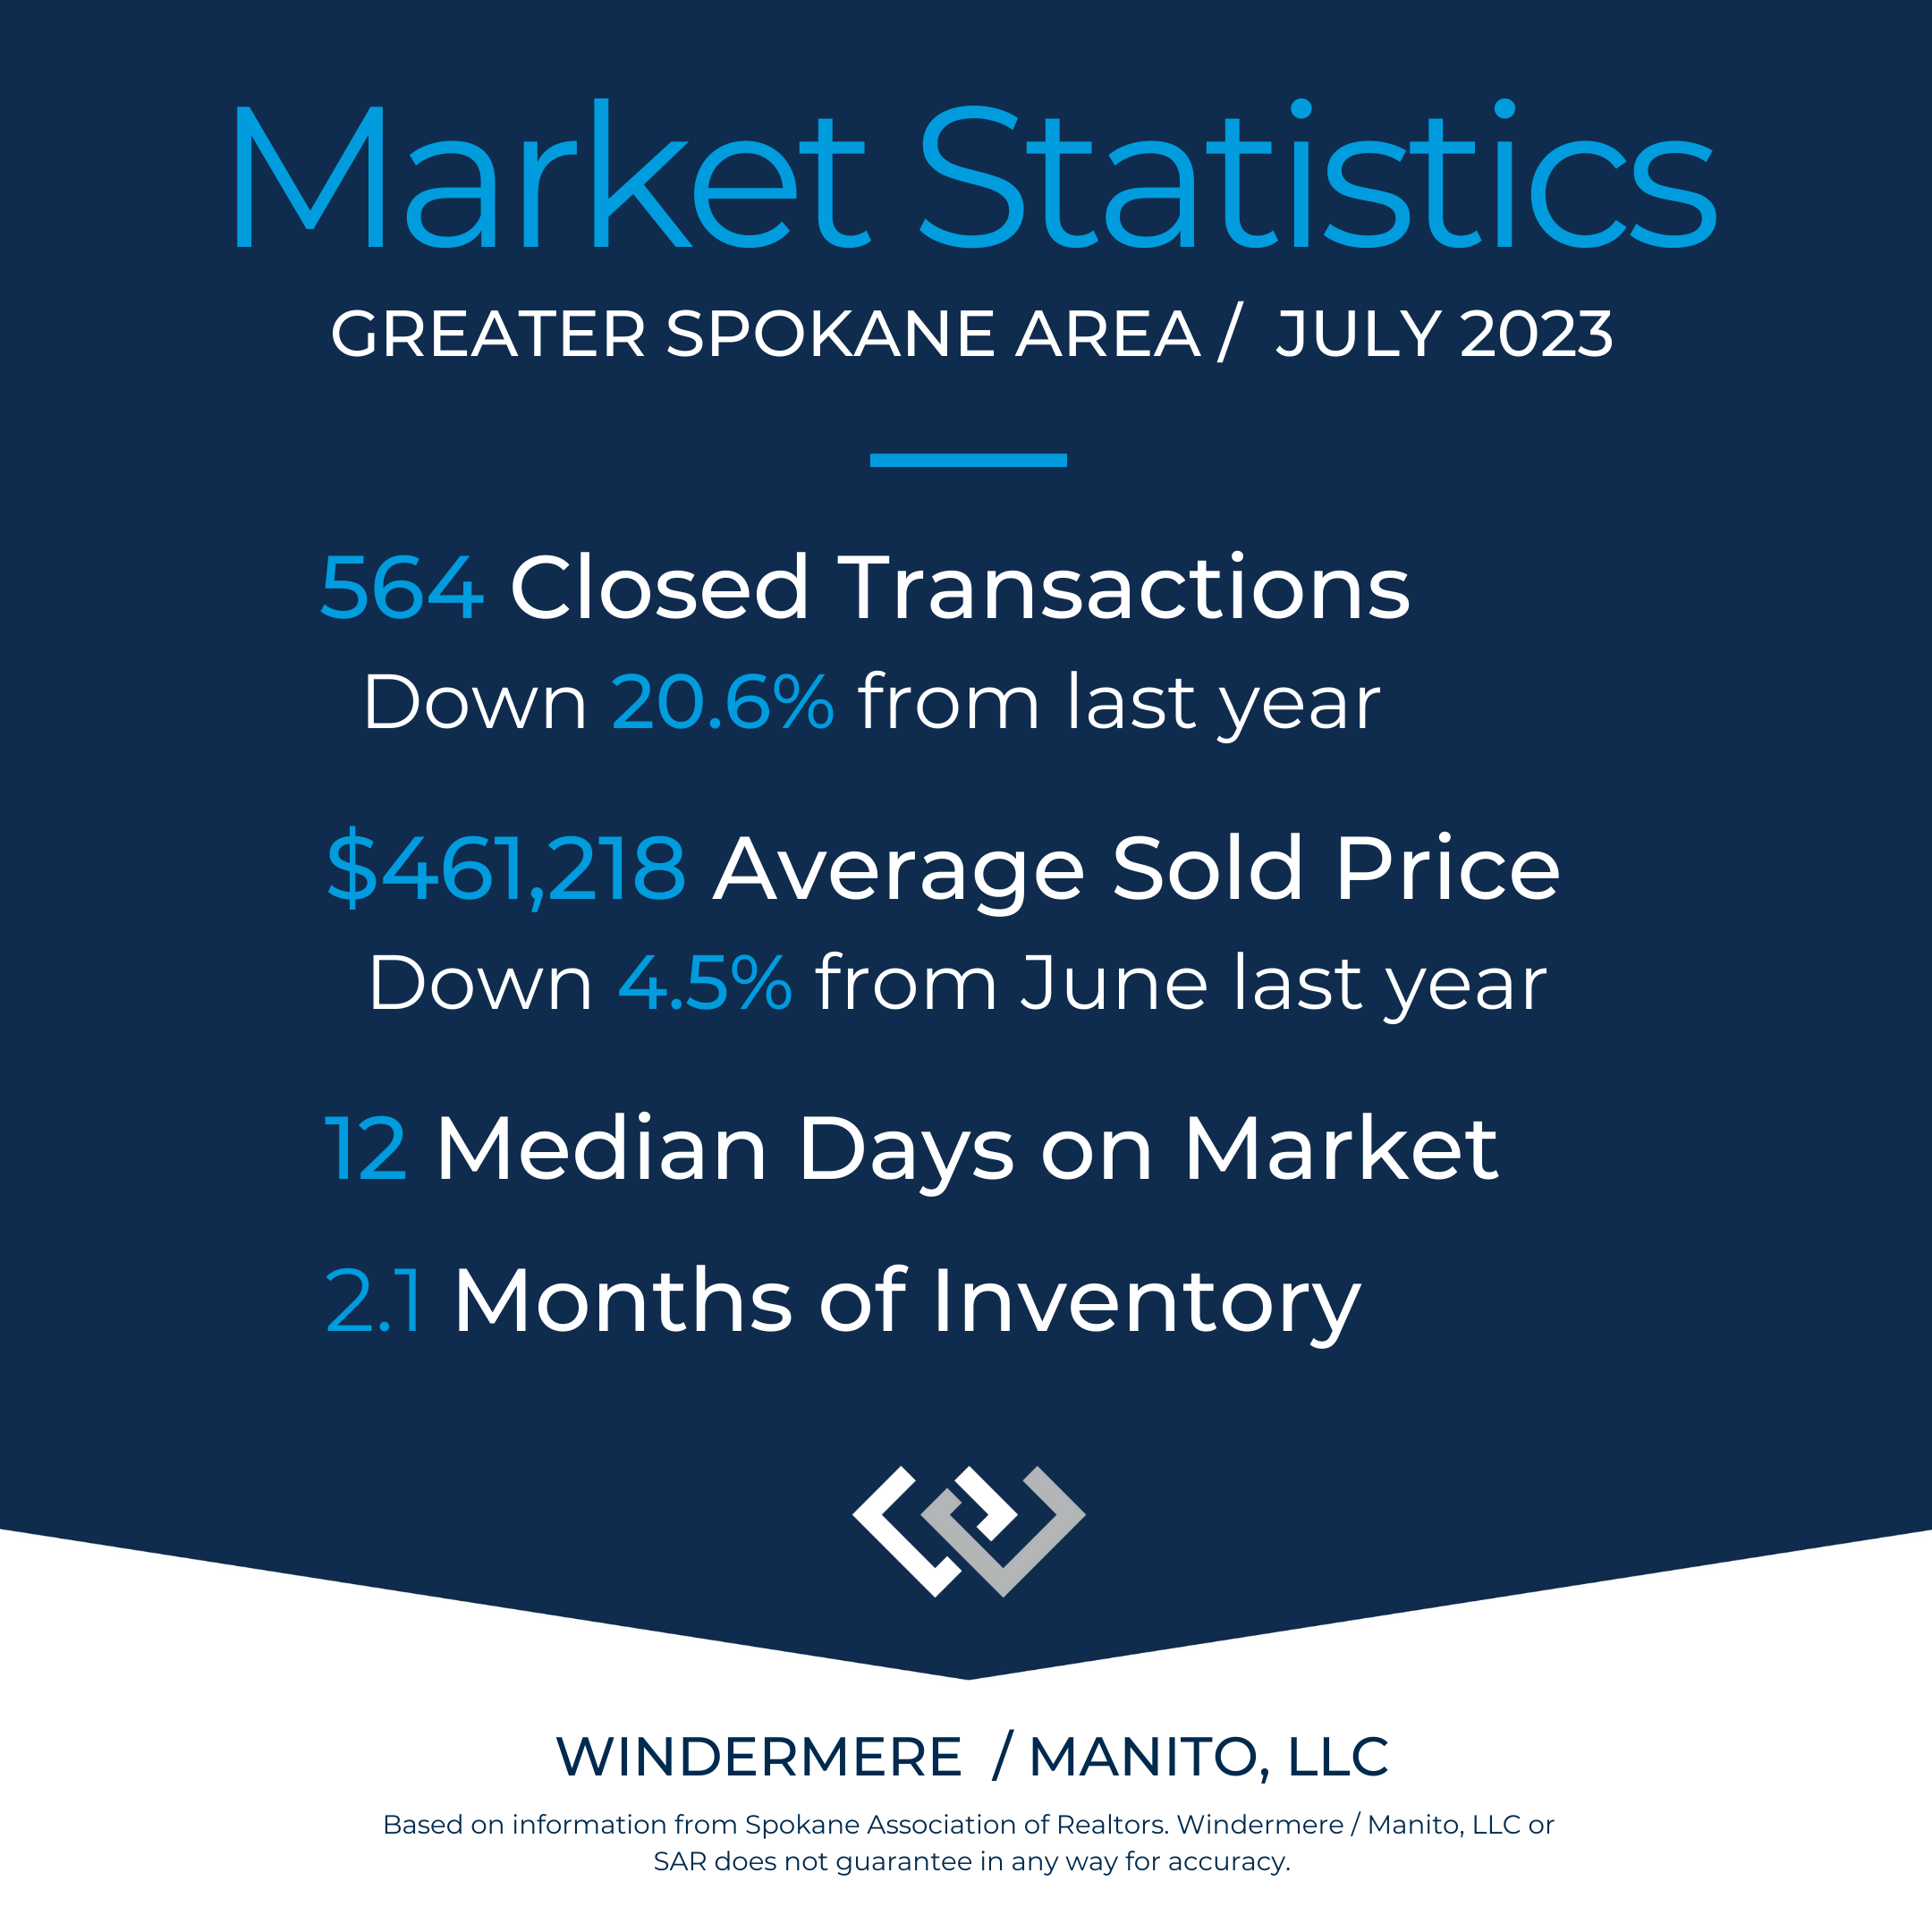
Spokane Market Observations
Like most of Western Washington, REALTORS working in Spokane and near-by areas are noticing less open house and tour traffic. That seems to result in a lower volume of offers for most appropriately-price homes.
However, buyers still active in the market are qualified, and still making solid offers to purchase listings. Days on market are approaching numbers we haven't seen in the last couple of years! The good news is, our market is trending more toward "balanced," where times are typically between 3 to 6 months. That sounds crazy - right? Our market has been SO CRAZY, FAST the last few years.
This trend is a wave of relief for home buyers. And, for home sellers, it is causing a bit of tension while we educate everyone on the dynamics of the current market + seasonal trends in residential home sales.
Want more - reach out to me. I'm happy to chat and share data.
